CHAPTER 11
Increasing Quality: where Quality has Subcomponents which are the Responsibility of Different Agencies
11.0 Introduction
11.0.1 Context
11.0.2 The purpose of this chapter
11.0.3 Acknowledgements
11.1 This example and its purpose
11.1.1 The story line of this example
11.1.2 The purpose of this example
11.2 The Subcomponents of quality
11.2.1 The importance of a LR and RGL
11.2.2 The subcomponents of quality and agency responsibility
11.2.3 How quality subcomponents interact and various viewpoints of “overall quality”
11.2.4 POT graphs for the subcomponents of overall quality
11.3 The part of the system where performance is to be “better understood”
11.3.1 Cases and structures for increasing quality
11.3.2 The SCS (schematic of core structure) for “better understanding”
11.3.3 Qualities subcomponents: current & target quality; Improvement Case types
11.4 The SD model and its purpose to “better understand”
11.5 Using the model - Scenarios enabling “to better understand”
11.5.1 The Scenarios
11.5.2 Comparing results from the Scenarios
11.5.3 What the Scenarios are indicating
11.6 Main Takeaways
11.6.1 Takeaways from the Scenarios
11.6.2 The need for clarity in the selection of the aim
11.6.3 Other takeaways from this example
11.7 Achieving the purpose of this example
11.8 Things that could be included in this model in a second pass
11.9 How this model could be used/integrated with models from previous examples
11.10 Key Points
Tables
11.1 Subcomponents of quality and responsible agencies
11.2 Subcomponents: current & target quality; Improvement case type
11.3 Main features of each scenario
11.4 How well the purpose of the example was achieved
Figures
11.1 LR and GLR are major operational entities in LA
11.2 How the quality subcomponents can be combined
11.3 POT graphs for the subcomponents of quality
11.4a Case A -IDA alone achieves a quality target
11.4b Case B -IDA only achieves part of the quality target,
11.4c Case C -Two agencies need to cooperate to each reach their quality target
11.4d Case D – The % of necessary maintenance funds approved by Treasury
11.5 A high level SCS (schematic of core structure),
11.6 Graphs for each scenario
11.7 The SCS of this example incorporated into the SCS of Chapter 9 example
Annex
A. Abbreviations Used
CHAPTER 11
Increasing Quality: where Quality has subcomponents which are held by different Agencies
11.0 Introduction
11.0.1 Context
Chapter 10 provided an example of treating the Quality of a Land Registry (LR) as a single entity and increasing quality. That example had a number of PIOs (performance improvement objectives) including increasing quality. They were increasing reputation; winning back customers; increasing revenue; achieving financial sustainability, all depended on quality being improved and sustained.
In reality, the quality of a LR is composed of a number of subcomponents, some of which are the responsibility of different agencies.
11.0.2 The purpose of this chapter
The purpose of this chapter is to: -
- Provide an example of quality being composed of subcomponents
- Examine the effects: -
- of different ways of calculating and viewing quality
- that different institutional responsibility for particular subcomponents can have when seeking to increase overall quality
- that inadequate provision for the annual maintenance of quality can have on the sustainability of quality
11.0.3 Acknowledgements
This chapter draws on Dr Kim Warren’s learning materials and models from his online SD extensions course1 dealing with quality. This is gratefully acknowledged. Any errors are the authors.
11.1 This example and its purpose
11.1.1 The story line of this example
The setting
A peri urban LR with 4 staff and ~ 10,000 titles. There are other officials who conduct upstream activities.
The background
An initial pilot project to improve quality in the LR and achieve some other performance improvement objectives (PIOs) has been carried out in a reasonably quiet LR in a semi-rural setting. This was essentially the example of Chapter 9. The initial pilot was largely successful and lessons have been learnt. A major lesson was that it would be better to treat quality as being composed of individual subcomponents.
As a result of the lessons learnt, senior provincial officials have decided to conduct a larger "learn by doing" pilot in a busier LR before scaling up. This pilot is to be conducted in two stages.
Stage 1 is to treat quality as being composed of individual subcomponents, where raising quality in each subcomponent needs to be done so as to increase overall quality. The aim is to better understand how each of these individual quality subcomponents contributes to overall quality, and how measure of overall quality can be used.
Stage 2 will focus on working with banks/formal lenders, so that banks are willing to accept more titles as collateral for development capital. This chapter deals with Stage 1 and a later chapter will deal with Stage 2.
The Situation now
Senior provincial officials require that the SD approach be applied to Stage 1, initially as a desk study so that they can better understand the implications of treating quality as comprising subcomponents. It is envisaged that further IDA (International development assistance) will be requested if the “learn by doing pilot” proceeds.
11.1.2 The Purpose of this example
This example is a little different from the previous examples where there were specific PIOs. In this example the purpose is for senior officials “to better understand” so as to make informed decisions.
The Purpose of this example is for senior provincial officials and senior managers in responsible agencies to better understand: -
- what the subcomponents of quality are
- the interaction between the subcomponents
- the different measures/viewpoints of overall quality
- how upgrading individual subcomponents can affect overall quality
- what the implications can be when some subcomponents of overall quality are the responsibility of different agencies.
With a view to determining an improvement strategy which could lead, over time, to: -
- The LR having a high reputation with customers, and the vast majority putting their land transactions through the LR
- The “property rights” document held or issued by the LR being recognised as being of very high integrity, conferring very high security of tenure, and providing evidence for the enforceability of property rights
- Banks being willing to accept property rights document from a LR as collateral for a mortgage (ie a source of development capital)
11.2 The Subcomponents of Quality
The subcomponents of quality apply both to a Land Registry (LR) which holds records of private land and also to a Registry of Government Land (RGL) which contains records of leased government land. RL will be used to refer to both in this chapter.
11.2.1 The importance of a LR and RGL
Chapter 2 covered the importance of the LR and the GLR as major operational entities in LA (land administration) and this importance was encapsulated in Fig 2.5, here shown as Fig 11.1
Fig 11.1
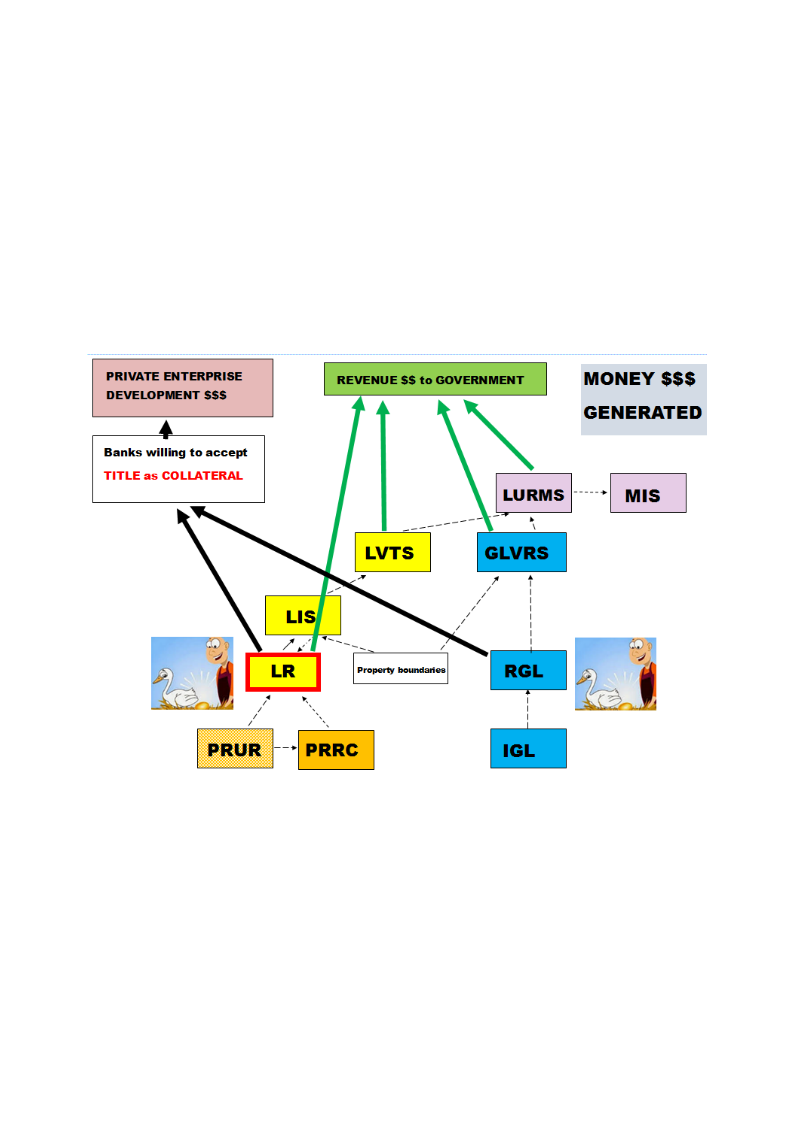
A LR and RGL will only deliver significant benefits if their overall quality is very high and titleholders, the community and business also have high confidence in the correctness of LR/RGL titles and the integrity of their operations.
11.2.2 The subcomponents of quality and agency responsibility
For the purpose of this hypothetical example the quality subcomponents listed in Table 11.1 are used and the responsible agency indicated.
Table 11.1
| Quality Subcomponent | Abbreviation | Responsible Agency | What Is Covered |
|---|---|---|---|
| Internal to the LR | |||
| Infrastructure | QInfra | LR | Physical infrastructure, including buildings, internal and external areas; technology, including the IT framework to allow specialist technology to be added. |
| Services | QSvcs | LR | Land services provided; procedures and workflows; technology to support services; staff skills; service levels aimed for; customer access to services; customer satisfaction. |
| Title Records | QTitleRec | LR | Completeness; currency; reliability; correctness. |
| Revenue Collection | QRevCol | LR | Workflow of collection; completeness and lack of leakage; integrity procedures and audits / spot checks; accounting procedures and reporting; trend tracking. |
| Integrity | QInteg | LR | Integrity of operations; likelihood of informal fees, favoured treatment or corruption; staff salaries adequate to counter the need for informal fees; transparency of operations; presence of standards of behaviour; legal ability to ensure integrity; management willingness to take action. |
| External to the LR | |||
| Title Boundaries | QTitleBdys | Cadastre | Completeness; currency; reliability; correctness. |
| Adequacy of O&M Budget | AdeqO&M | Treasury | The level of maintenance funding needed to ensure a high level of quality can be maintained post IDA. |
| Approval to Use Some Revenue for O&M | ApprovUseRev | Treasury | Whether the Treasury Department approves the use of a small percentage of revenue collected to ensure O&M is adequate. Keep the golden goose alive. |
| Security and Enforceability of Property Rights, in Law and Practice | QPR | Justice | Property rights secured in law; enforceability secured in law; administrative and judicial process; number of property disputes and length of time to resolve; effectiveness of dispute settlement; effectiveness and timeliness of enforceability; willingness and effectiveness of management and politicians to address issues. |
| Degree of Guarantee of Title Provided by the State or by Private Insurance | DegGuar | Justice | Degree to which the state or private insurance guarantees titles held in the LR / RGL. |
Comments on Table 11.1
- Quality of title records can only be increased to a certain level in isolation. They can be increased to a higher level when done in conjunction with increasing the quality of title boundaries. The same holds for increasing the quality of title boundaries in isolation. When title records and title boundaries are integrated and of high quality, a LIS (Land Information System) is formed; Fig 11.1 refers. A quality LIS that is maintained forms the basis for effective upstream LA operational entities as illustrated in Fig 11.1. These upstream entities are examined in later chapters.
- In some cases (e.g. services, integrity, security and enforceability of property rights) increasing quality may happen in two stages; the first being with achieved with IDA, and the final quality target only able to be reached when changes to legislation are enacted and operationalised. There can be long delays before legislation is enacted.
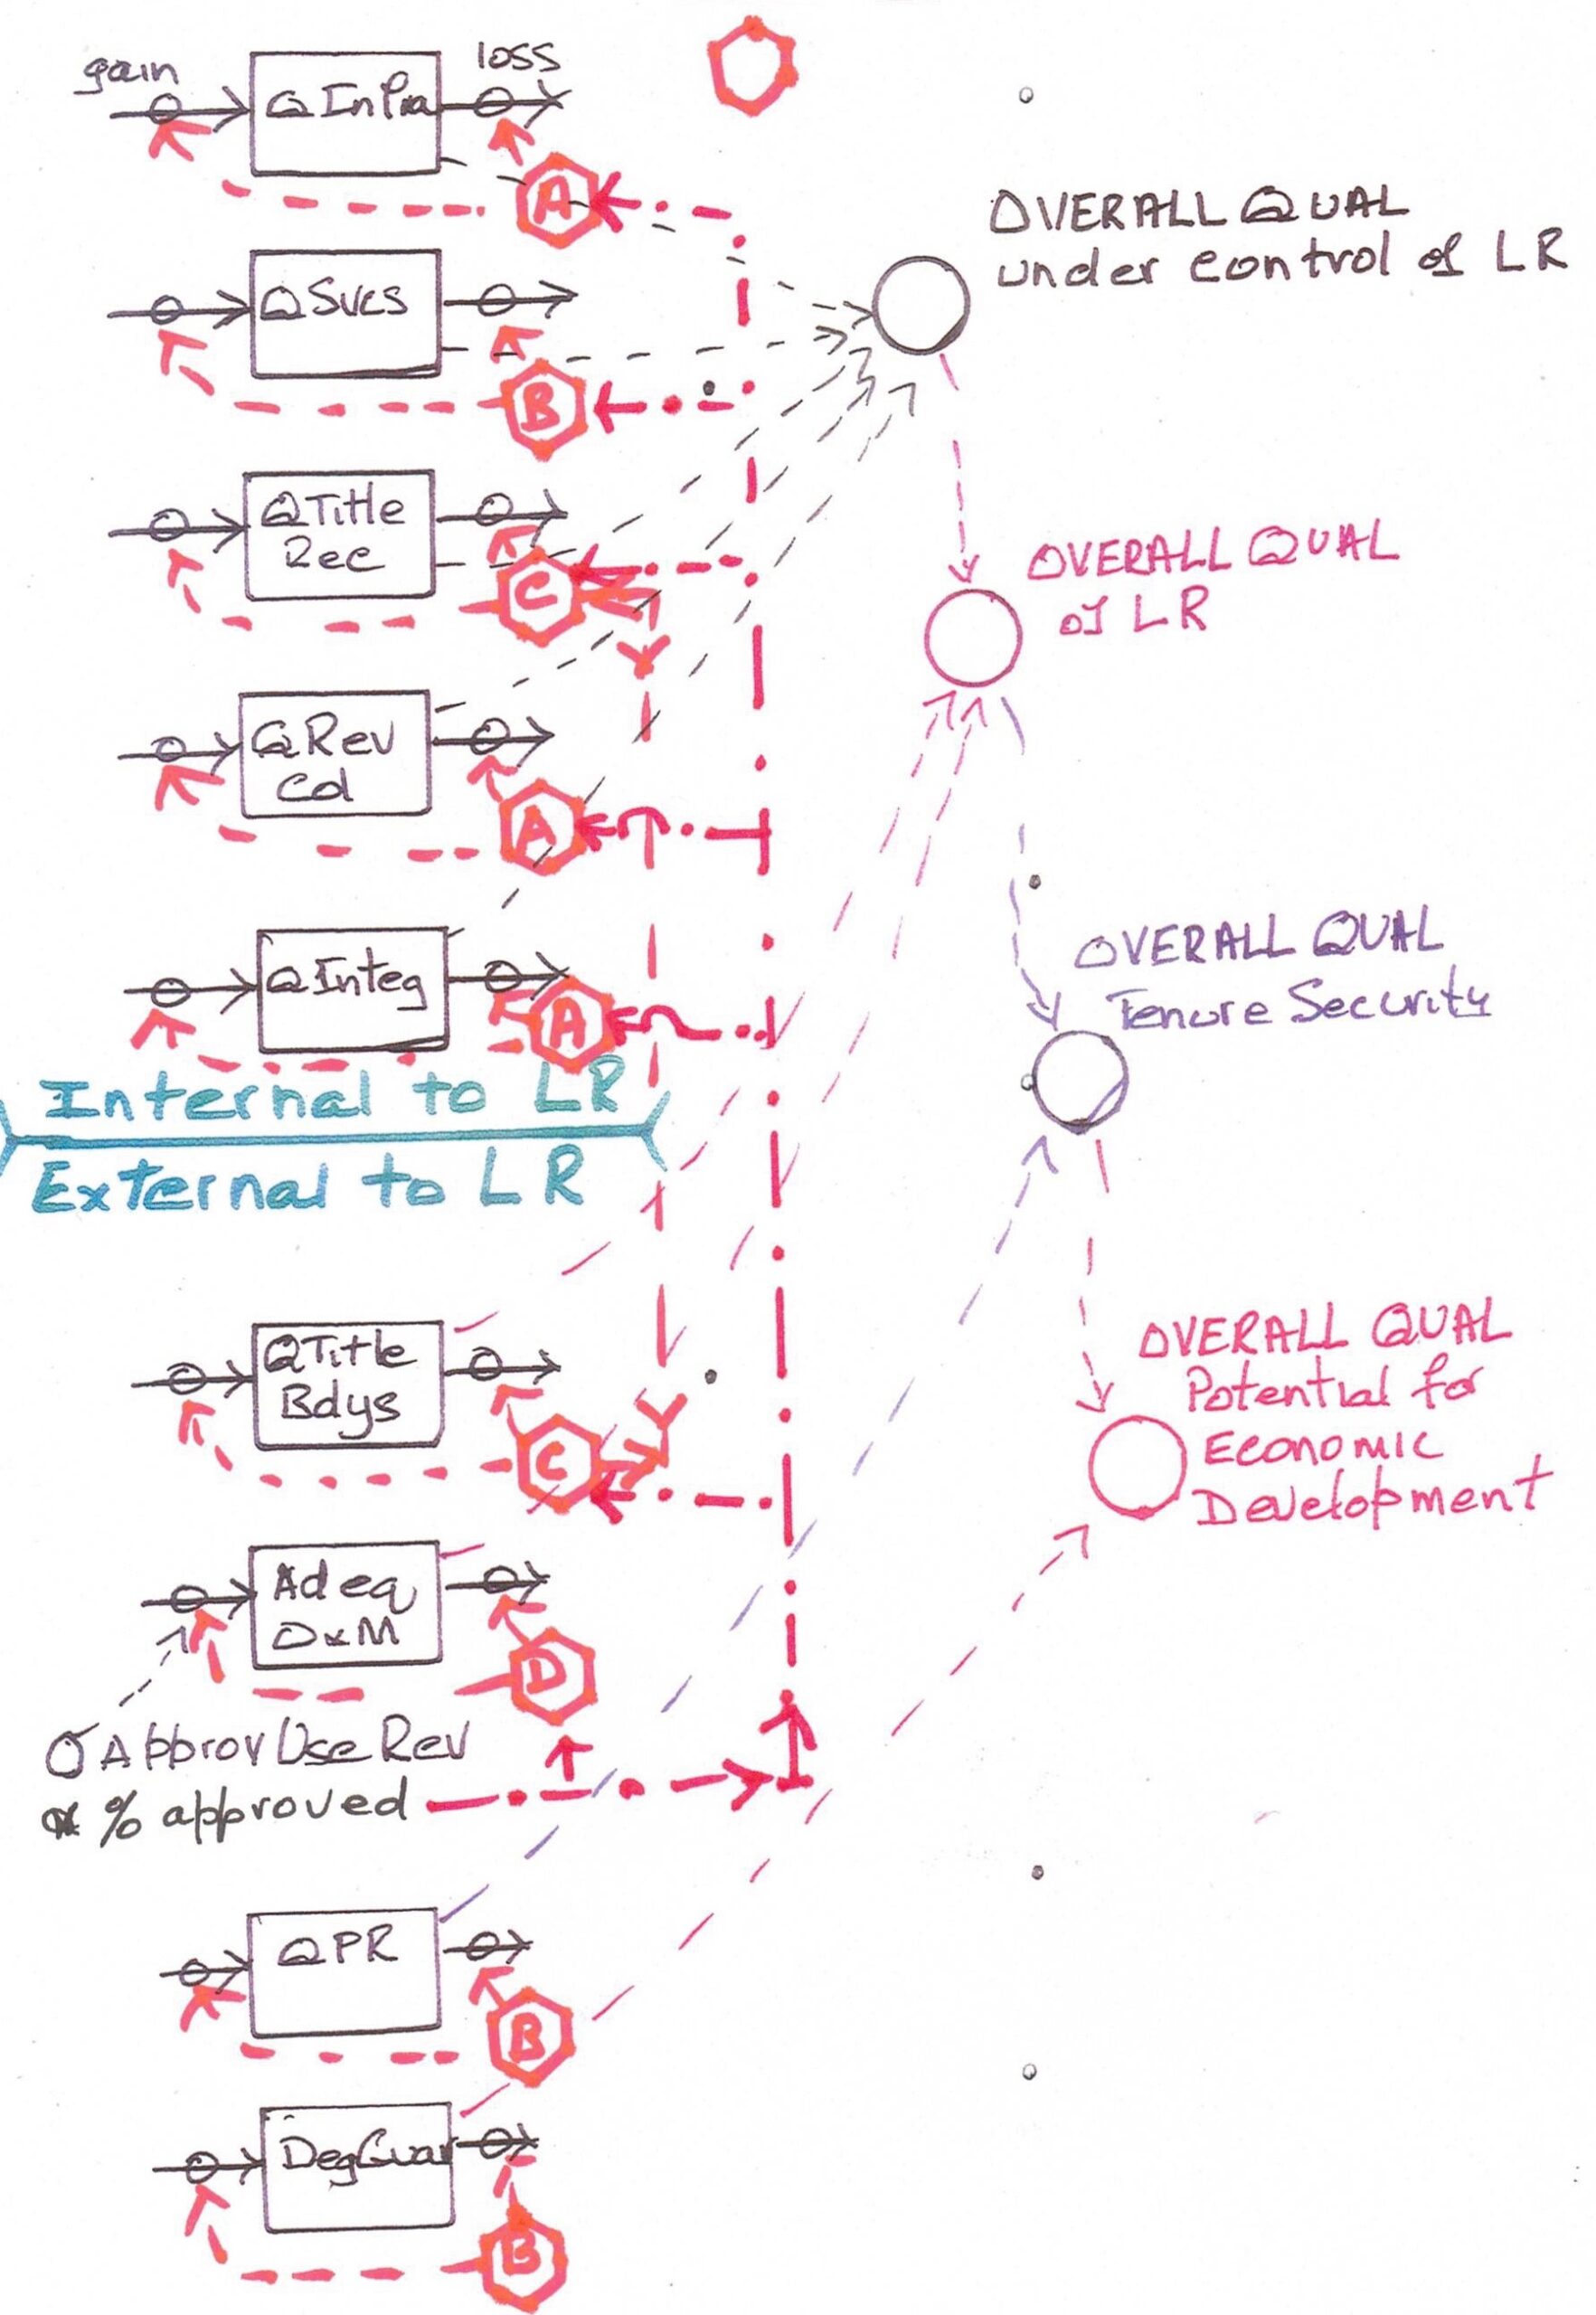
11.2.3 How the subcomponents of quality combine to give measures of “overall quality”
Fig11.2 shows schematically how the subcomponents of quality can be combined to compute different measures or “viewpoints” of overall quality. Viewpoints shown are: -
- Overall quality (under control of LR)
- Overall quality (of LR)
- Overall quality (tenure security)
- Overall quality (assist economic development)
Fig 11.2
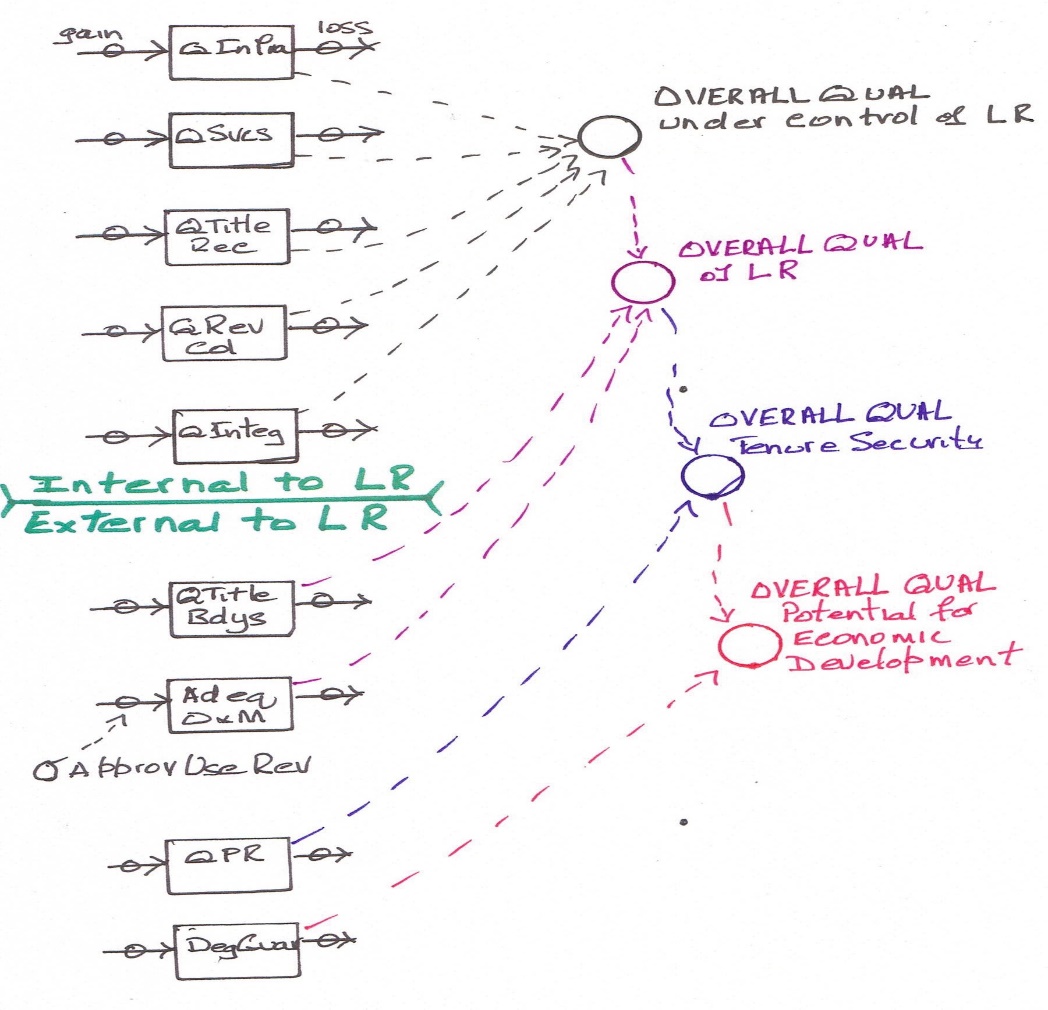
NB:It may be useful to keep this figure in mind during the remainder of this chapter as it provides a simple schematic to the terms used and how they relate.
Comments on Fig 11.2
Each quality subcomponent is shown as a stock with an inflow (gain) and outflow (loss). Discussed in Fig 11.3. The values of any of the “Overall Qualities” will depend on the values of their subcomponent stocks at any point in time.
Overall quality (under control of LR) – These are the quality subcomponents that are completely under the control of the LR.
Overall quality (of LR) – This includes the overall quality (under control of LR) plus two subcomponents that are not under the control of the LR, viz (a) treasury approval to use some revenue to provide adequate O&M so that quality can be sustained, (b) the cadastre so that property boundaries can be combined with LR title records to assist data cleansing, data validation and increasing the quality of both data sets, (c) the combined data set used to form an LIS.
The position of the LIS is shown in Fig 11.1. It provides the property base layer of the LVTS2 and GLVRS as well as the LURMS and MIS. To be effective an LIS needs to be updated regularly from the LR and cadastre. Achieving high records quality for a LR and cadastre (and hence an LIS) from a low quality base is not low cost or quick. This has important implications for effectiveness and costs for LVTS, GLRS, LURMS and MIS, if the agencies responsible to these go it alone, if an LIS does not exist, or is not available via cooperation between different agencies.
Overall quality (tenure security) - This includes overall quality (of LR) plus the subcomponent of security and enforceability of property rights (in law and in practise). While this later subcomponent is not under the control of the LR, it has an important bearing on how titleholders perceive the “usefulness” of a title3 issued by a LR, and the value for money in putting property transaction through the LR. If overall quality (tenure security) is seen to be high enough to afford very high tenure security, then value for money (LR fees) is likely to be seen, and titleholders will have an incentive to use the LR.
Overall quality (assist economic development) – This includes overall quality (tenure security) plus the subcomponent of the degree of guarantee of title provided by the state or by private insurance.
Banks will make a commercial decision on whether or not to accept a title as collateral for a loan. There will likely be a number of thresholds:-;the quality of the title; any guarantee of the title; the security and enforceability of property right, including repossession in the case of default; the credit worthiness of the titleholder and ability to repay;
The use of this overall measure of quality will be examined more fully in a later chapter.
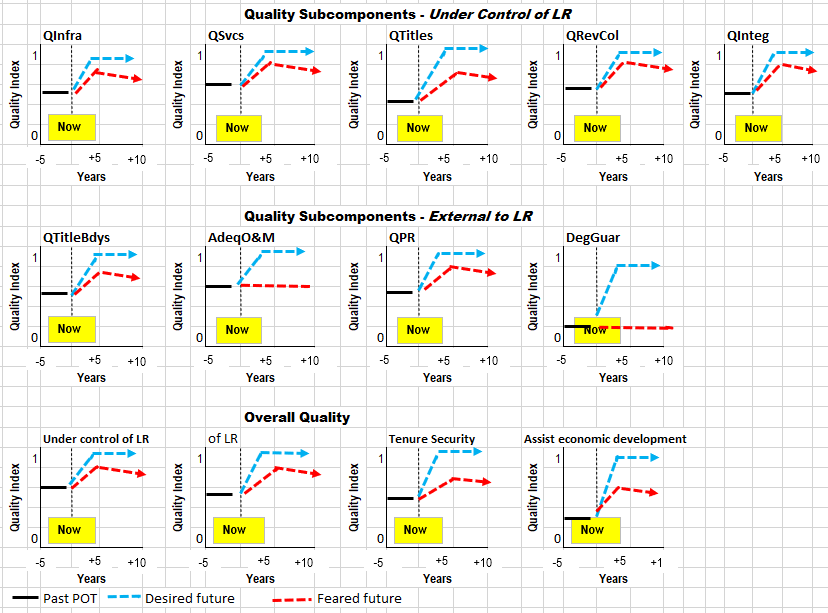
11.2.4 POT (performance over time)graphs for the subcomponents of quality
Fig 11.3 shows the POT (performance over time) graphs of past performance, desired future performance and feared future performance for the various subcomponents. Quality on a 0-1 index. The story line indicates that these POT graphs were compiled with senior provincial officials and managers of the responsible agencies. It was noted that while some countries have some degree of government guarantee of titles and some have title insurance (DegGuar), this country has neither.
Fig 11.3
11.3 The part of the system where performance is to be “better understood”
The purpose of this example (Sec 11.1.2) is to “better understand” the interaction of the subcomponents of quality and their effects on overall quality, (rather than improve part of the system as in previous examples). Fig 11.2 showed a schematic of the various quality subcomponents as stocks with inflows (gain in quality) and outflows (loss of quality), and how they can combine to give four different viewpoints (measures) of overall quality. The following subsection looks at particular cases and their structure for how quality can be increased and lost.
11.3.1 Cases and structures for increasing quality
Fig 11.2 showed a high level schematic for the subcomponents and the various viewpoints of overall quality. This provides a high level SCS (schematic of the core structure). Figs 11.4a,b,c,d, provide SCS segments for four different ways the quality of a subcomponent could be increased.
- Fig 11.4a shows Case A where once off aid alone achieves the quality target for a subcomponent.
- Fig 11.4b shows Case B where once off aid only achieves part of the quality target, and achieving the remaining part of the quality target depends on certain actions (e.g. enacting legislation being carried out by IC (in country) bodies.
- Fig 11.4c shows Case C where achieving two separate subcomponent quality targets depends on cooperation between two different responsible agencies. If each go it alone, then each can only reach part of their respective quality targets. An example is where the LR Agency is responsible for title records and the Cadastre Agency is responsible for title boundaries.
- Fig 11.4d shows Case D where the value of a quality at a point in time (in this case Adequacy of the O&M budget) depends on the % of the extra necessary maintenance budget approved by the Treasury Agency at any point in time.
- Table 11.2 shows which of the four cases are applicable to the various quality subcomponents
Fig 11.4a Case A structure
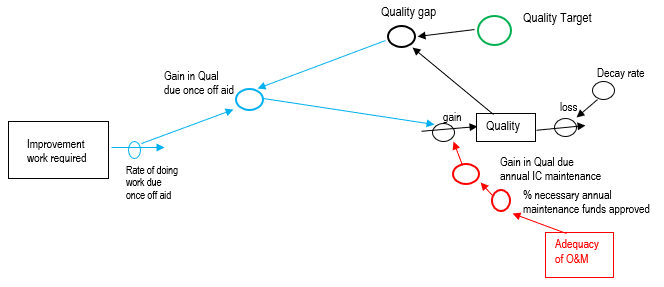
Comments on Fig11.4a
- The depiction in black indicates the current situation. There is a stock indicating the number of improvement tasks that need to be carried out to raise the current level of quality (a stock) to a designated target value by closing the quality gap. Quality can be gained and lost. There is a decay rate to quality.
- The depiction in blue indicates the once off aid provided to upgrade quality from its current value to the target value. Aid provides the assistance to undertake the improvement tasks. There is a rate of completing those tasks which allows the quality gap to be closed, and there is a corresponding gain in quality from this once off aid assistance.
- The depiction in red illustrates actions that provide for the responsible IC agency carrying out regular quality maintenance to ensure that the quality target is sustained post aid. If Treasury approves the funds for 100% of the necessary annual maintenance, then the gain in quality from regular maintenance will be equal to the normal loss in quality due to decay, and thus the target for quality will be sustained. If there is less than 100% of the necessary funding provided, there will be a slow decay in quality from the target value over time. This will be examined further in this chapter. [This is similar to the structure to upgrade and maintain quality used in chapter 9. Annex G, Aside1 in Chapter 9 is relevant to sustaining quality.]
Fig 11.4b Case B structure
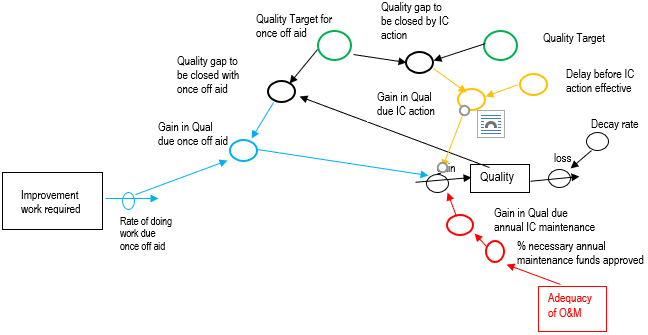
Comments on Fig11.4b
- The depiction in black indicates the current situation and is similar to that described for Fig 11.4a with one variation. There is a target for quality and a target of lesser value that the aid can achieve. There is a gap in quality that can only be closed by in country (IC) action. The IC action is such as getting laws enacted, ministers issuing directives, managers implementing and enforcing, and similar. There are delays while laws etc are waiting to be passed. These delays can be quite long and affect the achievement of the full quality target.
- The depiction in blue indicates improvement work carried out and quality gained out with once off aid assistance
- The depiction in yellow illustrates delays relating to passing legislation and similar that also affect achieving the quality target. Delays can be quite long, and this directly affects the time before a quality target is finally reached.
- The depiction in red indicates the amount of necessary annual maintenance conducted by the IC agency. This is the same as was commented on for Fig 11.4a
- A variation of this case can be establishing two lower quality targets, as well as the final quality target. This could be applied in the case of the Quality of Property rights security and enforcement. The first lesser target for when the legislation is drafted, the second for when the legislation is enacted, and the final target for when there is evidence that the legislation is being enforced.
Fig 11.4c Case C structure
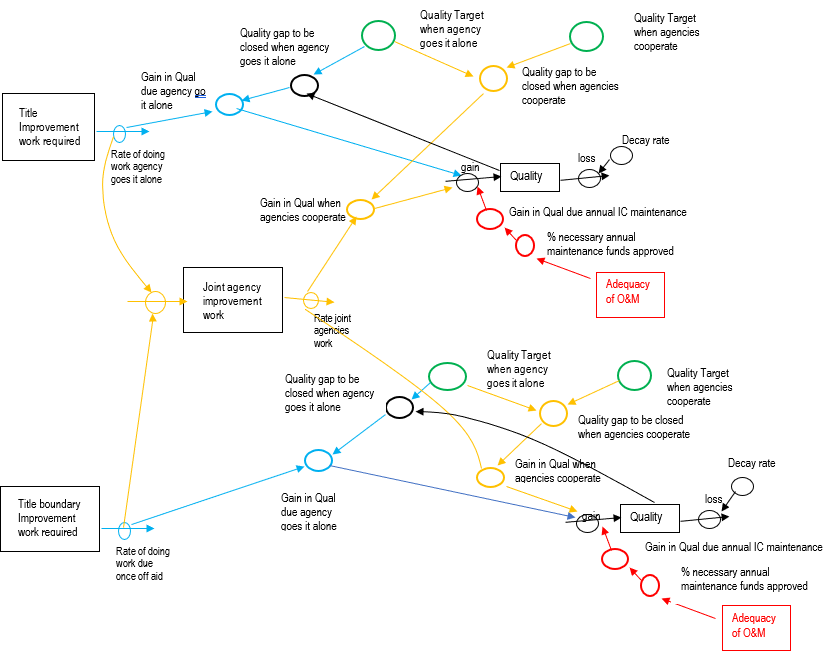
Comments on Fig11.4c
- The depiction in black indicates the current situation and is similar to that described for Fig 11.4b with a variation that two agencies can each reach their individual quality target if they cooperate. The single solid black lines depict the LR and its tasks and quality relating to title records and also the Cadastre agency and its tasks and quality relating to title boundaries.
- The depiction in blue indicates the improvement activities carried out as well as the quality gained with once off aid assistance and by each agency going it alone on quality improvement
- The yellow lines indicate improvement tasks that can be done jointly by both agencies to improve the quality of their respective datasets and then merge them to form an LIS.
- The depiction in red indicates the amount of necessary annual maintenance to be conducted by the IC agencies.
- It can be seen that if each agency goes it alone, then only part of the quality target of each will be achieved. However, if they cooperate, after initially working on their own datasets, and then work together using both datasets jointly, then their respective quality targets can be achieved.
Fig 11.4d Case D
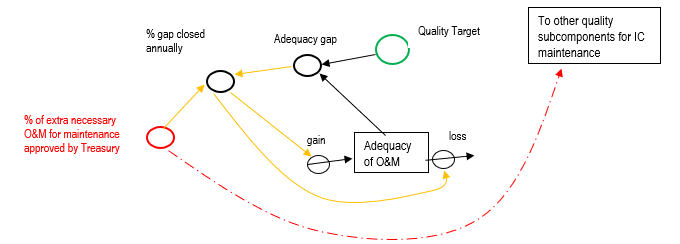
Comments on Fig11.4d
- In this case Treasury decides annually what % of the extra necessary maintenance budget will be provided. It could vary between 0 and 100%.
- In the case of 100% extra maintenance being provided, the adequacy gap is fully closed and there is a gain in adequacy of O&M equal to the adequacy gap. Also 100% of the extra maintenance being provided ensures that the gain to maintain quality in each of the subcomponents of quality is sufficient to ensure that their respective quality targets are sustained.
- In the case of 0% extra maintenance being provided, then there will be no change in the value of Adequacy of O&M, there will also be no regular maintenance of quality for each of the quality subcomponents, and their quality rating will decrease.
- For values <100% there will be some gain in the adequacy of O&M, but there will be losses.in quality for each quality subcomponent
11.3.2 The SCS (schematic of core structure) for “better understanding”
Fig 11.5
Comments on Fig11.5
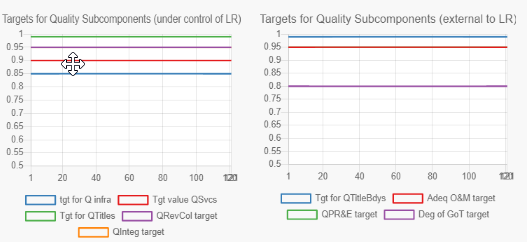
11.3.3 Quality subcomponents: current & target qualities; Improvement Case type
Table 11.2 shows what was considered the current and target quality ratings for each of the subcomponents, by provincial and agency management. Also shown is the improvement work required to reach the quality target, as well as the case type for improvement, and any applicable intermediate quality target.
The very high target ratings for qualities for LR records, property boundaries, and integrity are because these are considered the bedrocks of reputation, customer satisfaction and willingness to put their land dealings through the LR. A very high rating for quality for revenue collection and integrity is necessary for government to have confidence in the operation of the LR, and for the treasury to be willing to consider approving the use of a small % of revenue collected to supplement the O&M budget for maintenance of quality, and hence sustainability of quality (i.e., keep the golden goose alive and producing). If adequacy of the O&M budget is not of high quality, then the likelihood of sustainability of quality will not be high.
| Table 11.2 Quality Subcomponent | Current Quality | Quality Target | Improvement Work Required to Reach Target Quality | Case Type for Improvement | Quality Target for Once-Off Aid Assistance | Specific IC Action Required to Reach Quality Target | Months Delay After Aid Target Reached |
|---|---|---|---|---|---|---|---|
| Internal to LR | |||||||
| Infrastructure | 0.55 | 0.85 | 1 remedial package | Case A | NA | Nil | NA |
| Services | 0.5 | 0.9 | 7 land services and 1 piece of legislation enacted | Case B | 0.7 | Legislation enacted | 10 |
| Title Records | 0.5 | 0.99 | 20k title packages | Case C | 0.75 | — | — |
| Revenue Collection | 0.45 | 0.95 | 10 processes | Case B | 0.75 | LR managers to implement | 12 |
| Integrity | 0.5 | 0.95 | 10 processes | Case B | 0.75 | Minister to enforce | 18 |
| External to LR | |||||||
| Title Boundaries | 0.4 | 0.99 | 20k title boundaries | Case C | 0.7 | — | — |
| Adequacy of LR O&M Budget | 0.7 | 0.95 | Approval below to be for 100% of need | Case D | NA | — | — |
| Approval to Use Some Revenue for O&M | 0 | 0.9 | Obtain a YES approval; approval may take 6 months | Obtain a YES approval | Obtain a YES approval | — | — |
| Security and Enforceability of Property Rights, in Law and Practice | 0.45 | 0.95 | Drafting and enactment of legislation | Case B | 0.5 | Legislation enacted | 18 |
| Degree of Guarantee of Title Provided by the State or by Private Insurance | 0 | 0.8 | Drafting of legislation, implementation plan and procedures | Case B | 0.2 | Legislation enacted and implemented | 24 |
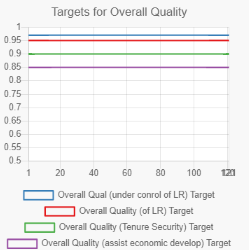
A first pass at targets for the various measures of overall quality are:-
- Overall quality (under control of LR) – 0.97
- Overall quality (of LR) – 0.95
- Overall quality (tenure security)- 0.90
- Overall quality (assist economic development)- 0.85
11.4 The SD model and its purpose to “better understand
An SD model was built based on the schemas of Figs 11.5,11.4a,b,c,d and the data in Table 11.2. Assumptions were made re the size of staff to carry out the improvement tasks, productivity, and the rate of progress for each subcomponent.
The purpose of the model (Sec 11.1.2 refers) is for senior provincial and agency managers to better understand: -
- the interaction between the subcomponents and the various viewpoints of overall quality,
- how upgrading these subcomponents separately can affect overall quality
- what the implications can be when the certain subcomponents of overall quality are the responsibility of different agencies.
As noted in the previous chapters dealing with examples, it is not the purpose of this book to go into the mechanics of building an SD model, but rather to show how operational insights can be drawn from using the model. Those interested in the model itself should contact the author at [email protected].
Limitations to the model and fitness for purpose
This model has not been validated as there is no past actual data on quality for the subcomponents. It is a hypothetical example and is best considered as a 1st pass at a working hypothesis. However, much can still be learnt from developing the SCS (schematic of the core structure) and using the model for exploring scenarios. Developing the SCS and the POT (performance over time graphs) graphs makes one think more deeply on the following questions:-
- what constitutes quality?
- how quality can be assessed; what its current levels are; what are the future desired level (target)?
- who has responsibility for particular subcomponents of quality?
- how can quality be increased, and very importantly sustained post aid?
- what do the various measures of “overall quality” indicate; how might they be used to indicate the achievement of the goals of LA (land administration)?
The story line of the example indicates that senior provincial and agency managers worked with the SD consultant to identify the subcomponents of quality, develop the POT graphs, identify current and target values for quality, and the work to be done to increase quality. This gives some confidence in the fitness for purpose of the model.
If there are alternative views on what constitutes quality then, using the SD approach, it is relatively easy to develop an alternative working hypothesis, an alternative SCS and model.
The following sections will show the results of using the model “to better understand”.
11.5 Using the model - Scenarios enabling “to better understand”
11.5.1 The Scenarios
A number of scenarios were developed and examined as a way to “better understand” and achieve the purpose of the model. Table 11.3 provides an outline of each scenario.
Table 11.3
| Scenario Name | Agencies participating besides LR | % of extra necessary annual maintenance funds approved by Treasury | Length of delays for Legislation to be enacted; managers to implement etc | |
| 1 | Base Case4 -Continue As Is | nil | 0% | NA |
| 2 | Desired Future | All (Cadastre; Treasury; Justice) | 100% | As in Table 11.2 |
| 3 | Feared Future | Nil (LR goes it alone) | 0% | As in Table 11.2 |
| 4 | Justice not participate | Cadastre; Treasury | 100% | As in Table 11.2 |
| 5 | Desired Future BUT delays doubled | All (Cadastre; Treasury; Justice) | 100% | Delay times doubled that shown in Table 11.2 |
| 6 | All Agencies participate but annual maintenance funds vary widely | All (Cadastre; Treasury; Justice) | % varies widely from year to year | As in Table 11.2 |
Aid is anticipated to be provided to all agencies participating. This aid should allow them to reach the quality targets that can be achieved with the once off aid. (Table 11.2 col 6 refers). A brief description of each scenario follows.
Scenario #1- Base Case or Continue As Is – In this scenario the existing situation continues. The quality of each subcomponent remains at its current level as there is no effort to increase quality and no aid is sought. This scenario provides the base case to compare the other scenarios with.
Scenario #2 - Desired Future – In this scenario all agencies (LR, Cadastre, Treasury, Justice) participate, aid is provided to all agencies, and Treasury approves the necessary extra maintenance funds to sustain quality. This could also be termed the best case.
Scenario #3 - Feared Future - In this scenario the LR “goes it alone” as the other agencies (Cadastre, Treasury, Justice) do not participate. Aid is only provided to the LR to increase the quality of subcomponents under its control and Treasury does not approve the extra maintenance funds to sustain any increased quality. Since the Cadastre Agency does not participate this means that the Quality of Titles cannot reach its target value because the boundaries of titles are not available to assist Title QA and data verification, i.e., Case C structure, Fig 4.11c applies.
Scenario #4 - Justice Agency Does Not Participate – In this scenario Justice is the only agency that does not participate. Aid is provided to the other participating agencies, and Treasury approves the necessary extra maintenance funds to sustain quality. The non participation of Justice means that there is in no increase in quality for the two quality subcomponents for which it is responsible, viz Quality of security and enforceability of property rights, and Adequacy of guarantee of title. These two subcomponents do not affect either Overall Quality (under control of LR) or Overall Quality (of LR) but will affect Overall Quality (Tenure security) and Overall quality (potential for economic development).
Scenario #5 - Desired Future But Delays Doubled– This scenario is the same as Scenario #2, desired future, but with delays doubled waiting for IC legislation to be enacted or managers to implement etc. (delays doubled from those shown in Table 11. 2) The final quality is not achieved until the legislation is enacted. It is not uncommon for long delays to occur between legislation being drafted and enacted. This scenario gives an indication of the effects of delays on achieving quality targets, or the affect if legislation, or other actions never occur.
Scenario #6 - All Agencies Participate But Annual Maintenance Funds Vary Widely - This scenario is the same as Scenario #2, desired future, but with the % of the extra annual maintenance funds necessary to sustain quality varying widely from year to year, depending on the financial status of the government. Less than 100% of the necessary extra funds means that some quality will be lost.
More scenarios are possible but the above is sufficient to give a range of results from which conclusions can be drawn.
11.5.2 Comparing results from the Scenarios
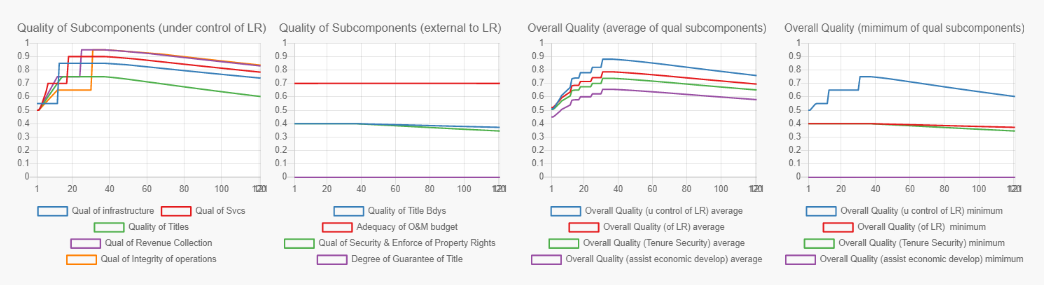
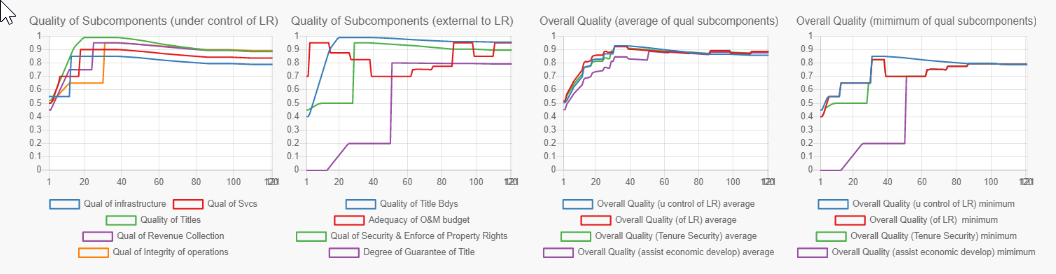
A comparison between the results from each scenario can be obtained from the graphs in Fig 11.6 (on the following three landscape pages).
Each scenario shows four graphs which, from left to right, are:-
- The quality for each subcomponent under the control of the LR over time
- The quality for each subcomponent external to the LR over time
- Overall quality for each of the four measures of overall quality5, based on the average quality of its constituent quality subcomponents
- Overall quality for each of the four measures of overall quality, based on the minimum quality of its constituent quality subcomponents
NB
- For Scenario #1 there are two rows of graphs. The first row contains the four graphs of the Base Case. The second row of three graphs show the quality targets being aimed for. These two rows have been separated to avoid clutter on the first row of graphs. A visual comparison shows the quality gap that needs to be closed to go from the current quality situation to achieve the quality target. This second row of graphs also allows a visual comparison of how well each scenario comes to achieving the quality target.
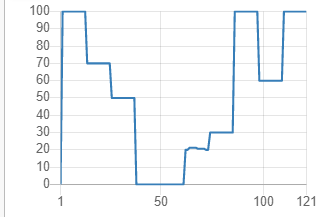
- For Scenario #6 there is one additional graph on the far right that shows the % of the necessary extra maintenance funds that Treasury has approved.
Fig 11.6
Row 1- Scenario #1- BASE (current) CASE
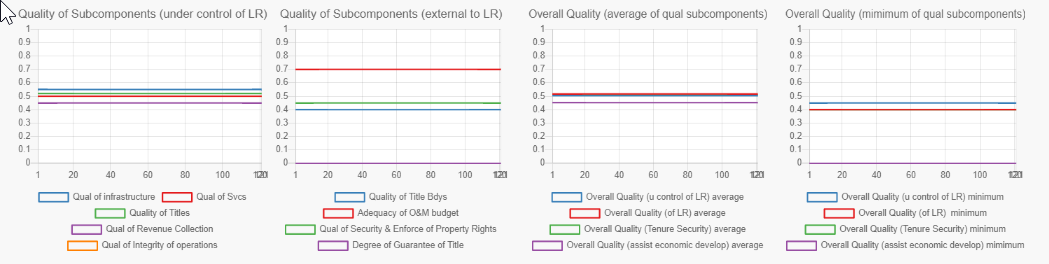
Row 2 – Quality Targets
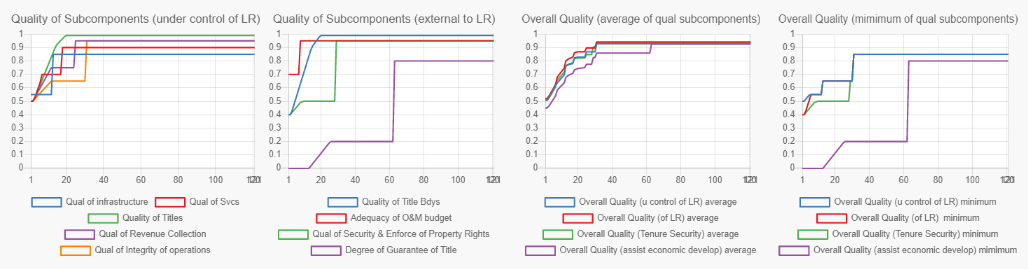
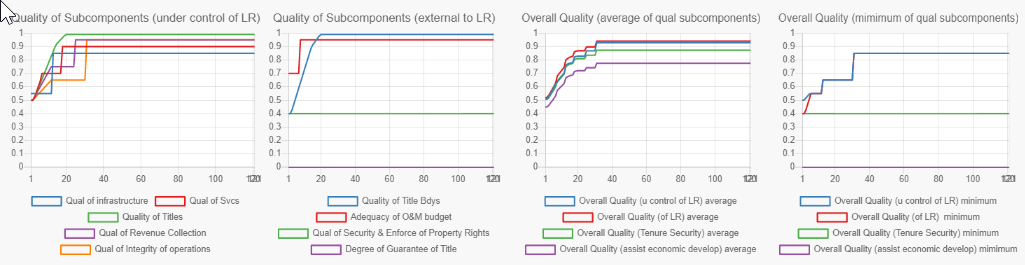
Scenario #2 - DESIRED FUTURE - -
Scenario #3 - FEARED FUTURE
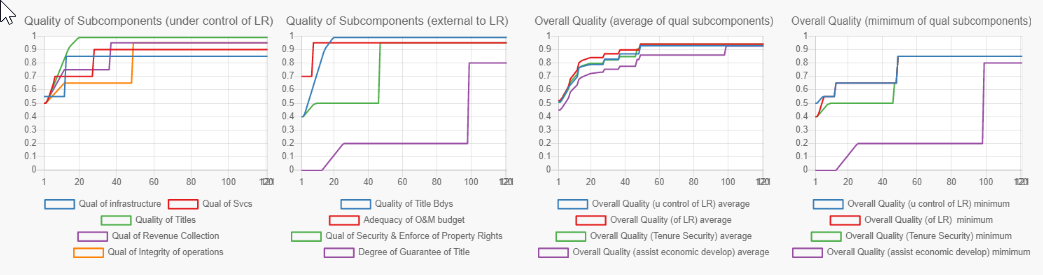
Scenario #4 - JUSTICE AGENCY DOES NOT PARTICIPATE
Scenario #5 - DESIRED FUTURE BUT DELAYS DOUBLED
Scenario #6 - ALL AGENCIES PARTICIPATE BUT ANNUAL MAINTENANCE FUNDS VARY WIDELY
11.5.3 What the Scenarios are indicating
Examining the graphs in Fig 11.6, allows observations to be made on each scenario.
Scenario #1- Base Case
Row 1 shows that all quality subcomponents have a low value and that there are variations between subcomponents. The differences between current quality (Row 1 graphs) and quality targets (Row 2 graphs) show that the quality gap to be closed is reasonably large.
Since the values of current quality of the subcomponents are low, the measures of overall quality will also be low. Overall quality calculated from the minimum quality of constituent subcomponents, will be lower than when calculated from the average quality of constituent subcomponents.
There is not necessarily a direct relationship between the size of the quality gap to be closed and the amount of work, cost and time required to close that gap.
Scenario #2- Desired Future
All quality subcomponents reach their target values. The rate of quality increase over time for each quality subcomponents and the time to reach its target quality is different. It depends on:- the size of the quality gap to be closed; the amount of improvement work to be done to close the gap; the resources allocated; the rate at which work is done; time required to close the gap; and any delays to reaching the final quality target, such as waiting for legislation to be enacted.
Some quality subcomponents will not reach their target values until sometime after the once off aid has finished. This is due to IC delays, e.g., in getting legislation enacted.
Quality targets are sustained, as 100% of the necessary extra maintenance funds are approved.
It can take longer for any of the various measures of overall quality to reach a steady value, depending upon the different rates of increase in constituent quality subcomponents.
There are large differences between the measures of overall quality, depending upon whether they are calculated using the average or minimum value of their constituent quality subcomponents.
Scenario #3- Feared Future
All quality subcomponents under the control of LR, except one, initially achieve their quality target. The quality of titles does not achieve its target as the Cadastre Agency is not involved, and hence titles cannot be cross checked with title boundaries to increase quality further.
Gains in quality cannot be sustained, as Treasury has not approved the extra maintenance funds to sustain the increased quality
The quality components, external to the LR, do not increase in quality from the base case values as the responsible agencies are not involved.
Some measures of overall quality cannot be sustained as the quality of their constituent subcomponents cannot be sustained.
Scenario #4- Justice Agency does not participate
The quality subcomponents under the control of the LR reach their quality targets and their quality is sustained. Quality of title boundaries is also achieved and sustained. Quality subcomponents under the control of Justice do not increase from Base Case values.
Overall Quality (under the control of LR) and Overall Quality (of LR) reach the same values as in Scenario #2 Desired Future. However, Overall Quality (Tenure security) and Overall Quality (assist economic development) are less compared to Scenario #2 as the Justice Agency is not involved ,and the quality subcomponents it is responsible for do not increase from their Base Case values.
Scenario #5 - Desired Future BUT delays doubled
All quality subcomponents reach their quality targets, but this takes much longer than in Scenario #2, Desired Future. Quality is sustained as the necessary extra funding for quality maintenance is provided. The various measures of overall quality also take longer to achieve a stable value.
It is easy to visualise the adverse results in short falls in quality if the delays became indefinite, e.g. necessary legislation is not passed, or management actions is not taken.
Scenario #6 - All Agencies participate BUT maintenance funds provided vary widely from year to year
All quality subcomponents reach their quality targets, but quality is not sustained as 100% of the necessary extra annual funds for maintenance are not provided. Consequently the various measures of overall quality will also not be sustained.
The loss rate in quality will depends upon how high or low the percentage approved annually is for the % of necessary extra maintenance funds. The higher the approved percentage then the less the loss . A graph showing the % used in this scenario is shown in Fig 11.6, Scenario #6, on the far right.
11.6 Main Takeaways
In Sec 11.5.3 immediately above, observations were made on each scenario. They are specific to the structure and data of this hypothetical example. However, some general observations can be drawn and these follow.
11.6.1 Takeaways from the Scenarios
- A more realistic and rigorous representation of the quality of an LR, is obtained by treating quality as being composed of subcomponents, some under the control of the LR and some under the control of other agencies, rather than treating quality of the LR as a single entity6.
- Different quality subcomponents will have different sized quality gaps to close, and this will require different amounts of improvement work. The amount of work and the rate of completing that work, as well as costs and durations, will depend upon the technology and approach selected. This will require quite careful consideration.
- Increasing the quality of subcomponents to target values with aid assistance, whilst having challenges, will probably be relatively straightforward. Maintaining the increased quality post aid will largely depend upon the necessary IC funding to maintain that quality at target values being made available consistently over long periods of time. If the necessary maintenance funding is not provided, then quality will decay, and the value of the improvement investment will also decay over time7.
- If agencies that have responsibility for particular quality subcomponents are not participating in the quality improvement effort, this can have quite an adverse effect on what is sought to be achieved.
- Close attention needs to be given to the effects of long delays before quality targets are achieved. Common long delays are the wait for legislation to be enacted or similar.
- Very early in design or scoping for quality improvement, it would be prudent to:-
- gain agreement with the IC Treasury Department on the funding level for maintenance, and then design for quality sustainability, rather than consider what might be possible with once off aid
- be clear on the aim of what is sought be achieved. This leads to the quality subcomponents and the responsible agencies. Sec 11.6.2 following discuss some aspects re clarity of the aim.
11.6.2 The need for clarity in the selection of the aim
In seeking to “increase quality” it is necessary to be very clear on what the aim (desired outcome) is. Is it:-
- To increase the quality of one subcomponent? Under the control of the LR? Which one? What would the increased quality result in:- increased internal processing productivity? An increase in integrity of operations, reputation/public confidence?
- To increase quality in several subcomponents? Which ones? Only internal to the LR? To increase the quality of Titles and Title boundaries (requires cooperation between the LR and Cadastre Agencies)? and as well develop an LIS as a base for upstream operational entities?
- To increase one or more measures of overall quality? Which measure? To achieve what? Should overall quality be calculated using the average or minimum value of its constituent subcomponents8?
A. Overall quality (under control of LR) – to make the LR internally more efficient?
B. Overall quality(of LR) – to increase reputation so that titleholders not using the LR are attracted back? To increase revenue to Government so that Treasury will allow some of the increased revenue to be used for maintenance to maintain quality (keep the golden goose of the LR producing increased revenue to government)?
C. Overall quality (Tenure security) – to increase the integrity of titles and public confidence in the security of property rights, thus reducing property disputes and contributing to social stability, one of the goals of LA?
D. Overall quality (contribute to economic development) - to increase the likelihood that banks (formal lenders) will be willing to accept titles as collateral for a mortgage thus providing development capital and contributing to economic development9, another goal of LA?
A Note re Overall quality (contribute to economic development)
The quality rating for some subcomponents required by a bank, when considering to accept or not a title as collateral, may be much higher than that normally associated with a LR. A bank may look for very high quality ratings for Titles, Integrity of operations, and security of property rights and their enforceability. The bank’s requirements for correctness and currency of Titles may be 99.99% correct; an error rate of <1/10,000. This has serious cost and time implications for (a) the once off “cleanse and verify” existing titles and records, (b) ensuring titles maintain their correctness and currency.
A very high rating for Overall quality (contribute to economic development) can be considered a necessary but not sufficient condition for bank willingness to accept titles as collateral. This is examined in more detail in a later chapter.
Each of the above aims will produce quite different outcomes and will require different:-
- Inclusion of specific quality subcomponents
- Levels of engagement between agencies
- Quality targets and quality gaps to be closed
- Types and amounts of improvement work to be done, budgets, and time to close the quality gaps
- Levels of IC management commitment and maintenance budgets for the long term sustainability of the quality targets
Hence it is vital that sufficient thought be given to selection of the aim, what is to be achieved, and how that is to be used. It is prudent for this to be clearly articulated, wide distributed, and buy in obtained.
If there are strongly held divergent views, the SD approach can be used to logically, transparently and quantitatively explore the various views.
11.6.3 Other takeaways from this example
Developing the SCS and the POT graphs makes one think more deeply on the following:-
- What constitutes the subcomponents of quality?
- How can quality be assessed? what are the current quality levels? what could be suitable quality targets?
- Who has responsibility for particular components of quality
- How can quality be increased, and most importantly, maintained post aid?
- What do the various measures of “overall quality” indicate? How might they be used to indicate the achievement of the goals of LA?
11.7 Achieving the purpose of this example
The purpose of this example was provided in Sec 11.1.2. Table 11.4 lists the purpose and indicates where each particular aspect was addressed.
Table 11.4
| The Purpose for senior provincial and agency managers to better understand: | |
| Purpose Element | How Achieved |
|---|---|
| What the subcomponents of overall quality are. | Table 11.2; Fig. 11.2 and associated text. |
| The interaction between the subcomponents. | Fig. 11.5 and associated text. |
| The different measures and viewpoints of overall quality. | Fig. 11.2 and comments; Fig. 11.5. |
| How upgrading these separately can affect overall quality. | Results from running the 6 scenarios, Section 11.5.2. |
| What the implications can be when some subcomponents of overall quality are the responsibility of different agencies. | Results from running the 6 scenarios, Section 11.5.2. |
| With a View To determining an improvement strategy which could lead, over time, to: | |
| View Element | How Achieved |
| The LR having a high reputation with customers, and the vast majority putting their land transactions through the LR. | Section 11.6.1, main takeaways from the scenarios regarding quality subcomponents; Section 11.6.3, the need for clarity in the selection of the aim. |
| The “property rights” document held or issued by the LR being recognised as being of very high integrity, conferring very high security of tenure, and providing enforceability of property rights. | Section 11.6.1, main takeaways from the scenarios regarding quality subcomponents; Section 11.6.3, the need for clarity in the selection of the aim. |
| Banks being willing to accept property rights documents from a LR as collateral for a mortgage, as a source of development capital. | Section 11.6.1, main takeaways from the scenarios regarding quality subcomponents; Section 11.6.3, the need for clarity in the selection of the aim. |
As a result of this desk study, senior managers will have gained a greater understanding of quality, its uses and related implications. This should assist in their decision on whether or not to proceed with a larger “learn by doing” pilot in a busier LR (story line refers), where quality will be treated as being composed of a number of subcomponents.
This larger “learn by doing” pilot would also provide valuable hard data for the design of the anticipated scaling up and roll out to many other LRs. The senior managers have indicated that they would only proceed if they could be assured of aid assistance for both this larger pilot, and a subsequent scale up and roll out. This analysis and their greater understanding should assist in discussion with potential aid partners.
11.8 Things that could be included in this model in a second pass
The following could be included in this model as a second pass: –
- Examine what the quality of subcomponents would need to be to achieve a designated target for the various measures of overall quality
- Include a variation of Case B structure (Fig 11.4b refers) to include two intermediate targets before the quality target is reached. The first intermediate target would be that achieved with once off aid. The second when legislation is enacted, and the final target when active implementation is undertaken and there is hard data on the quality actually achieved
- Include more interdependence. e.g. the quality of infrastructure will affect the quality of records and services; the quality of records will affect the quality of services and integrity; the quality of integrity will affect the quality of services and revenue collected
- The composition and numbers of the workforce (i.e., international and national staff) estimated to carry out the improvement work for each quality subcomponent
- The cost of the improvement work for each quality subcomponent, including staff costs, procurement, project costs etc, as well as in total
- The IC cost of the extra annual maintenance needed to maintain each subcomponent at its quality target
- Assign weights to reflect the relative importance of each quality subcomponent using Warren’s Value Curve technique10. Greater weight could be given to subcomponents such as quality of titles, integrity of operations, quality of services, adequacy of O&M.
11.9 How this model could be used with models from previous examples
The purpose of this example was to show how quality could be better approached by considering it as being composed of a number of subcomponents, rather than as a single entity. In chapter 9, quality was considered as a single entity in a larger system which had a number of PIOs, including increasing quality. Fig 11.7 shows how the SCS of this example from Fig 11.5, could be incorporated into the SCS (Fig 9.2) of the larger system of the example of Chapter 9. Essentially, the single stock of quality in the SCS of the chapter 9 example Fig 9.2), would be replaced by the multiple stocks representing the subcomponents of quality, together with overall quality (of LR).
In Chapter 10, it was indicated how the staff development model could be incorporated into the model of chapter 9.
Fig 11.7

11.10 Key Points
-
Treating quality as comprising a number of subcomponents is more realistic than treating quality as a single entity. This makes one think more deeply about what constitutes quality, how to measure it, and how to increase it.
-
It can take considerable time to reach a subcomponent quality target, particularly where changes to legislation are necessary. This can have serious adverse impacts on the measures of overall quality.
-
The initial investment in quality improvement will decay over time unless the increased quality is maintained post aid by sufficient in country funding.
-
Careful consideration needs to be given to whether to use the average or minimum value of constituent subcomponents when calculating the various measures of overall quality. A strong case can be made for using the minimum value, however there are cost and time implications.
-
Clarity of the aim is very important when seeking to improve quality.
-
As in previous examples, this example and the results shown, are not the most important part. The important aspect is how the SD approach can be used. If one does not agree with the logic and structure of the SCS or the structure of the SD model, then it is relatively simple to develop an alternative SCS and SD model and use them. The most important point is that the SD approach is logical, quantitative and transparent, with no implicit assumptions or hidden hard wiring.
ANNEX A
| Abbreviation | Meaning |
|---|---|
| IC | In-Country |
| IDA | International Development Assistance |
| LA | Land Administration |
| LBM | Living Business Model |
| LR | Land Registry |
| O&M | Operations and Maintenance |
| PIO | Performance Improvement Objective |
| POT | Performance over Time |
| RGL | Registry of Government Land |
| SCS | Schematic of Core Structure |
| SD | Strategy Dynamics |
Footnotes
- 1 https://www.sdcourses.com/ ↩
- 2 LVTS – land valuation & tax system; GLRS – government land rent system; LURMS – land use resource management system; MIS – municipal information system ↩
- 3 Title is used here generically to refer to documents issued by a LR which record rights ↩
- 4 This is the current situation with No Change ↩
- 5 Overall quality (under control of LR); Overall quality (of LR); Overall quality (tenure security); Overall quality (assist economic development) ↩
- 6 as done in Chapter 9 ↩
- 7 Chapter 9 showed how the retention of a small % of revenue collected can provide the necessary extra funding for sustainability. ↩
- 8 In the case of a LR and LA a strong case could be made for using the minimum ↩
- 9 In countries where banks routinely accept titles as collateral the amounts of development capital raised are not trivial. ↩
- 10 Illustrated in the Strategy Dynamics extension course; https://strategydynamics.com/msd2012/ ↩