CHAPTER 12
ADDRESSING INFORMAL FEES
12.0 Introduction
12.0.1 Context
12.0.2 The purpose of this chapter
12.1 This illustrative example; PIOs and POT graphs
12.1.1 The storyline of example
12.1.2 The PIOs (performance improvement objectives)
12.1.3 POT graphs of the PIOs and PIs for past, desired and feared future performances
12.2 The system in which performance is to be improved
12.2.1 The system in which performance is to be improved
12.2.2 A SCS (schematic of the core structure) of the system in which performance is to be improved
12.2.3 What the SCS is indicating,qualitatively,about the dynamics in play
12.2.4 The PIPs (Proposals to Improve Performance) of the system
12.2.5 A briefing and discussion session with management
12.3 Building and using the SD model to test the PIPs and Scenarios
12.3.1 Building the SD model
12.3.2 Showing that the SD model can replicate past POT
12.3.3 PIPs/ Scenario to be tested for effectiveness and sustainability
12.3.4 Comments on Scenario results
12.4 Improvement Strategy, Risk Identification and Mitigation
12.4.1The improvement strategy from testing the PIPs/Scenarios
12.4.2 Risk identification, What Ifs, risk mitigation
12.4.3 Improvement strategy including risk mitigation
12.4.4 Gantt Chart– First Pass
12.5 Provincial Government decision re implementing the improvement strategy
12.6 Value of this example, things that could be included, and used elsewhere
12.7 Key points
Tables
12.1 Initial and final target values
12.2 Scenarios tested
12.3 Risks and qualitative effects
12.4 Risks and quantitative impacts
Figures
12.1 POT graphs for PIOs and PIs
12.2 The SCS of the system where performance is to be improved
12.3 The SCS of the PIPs
12.4 Comparison between actual past POT and the model trajectory
12.5 Comparisons of Scenarios based on KPI, PIOs, PIs
12.6 Gantt chart
Annexes
A The Why, Why, Why diagram
B Abbreviations used
CHAPTER 12
ADDRESSING INFORMAL FEES
12.0 Introduction
12.0.1 Context
It is not uncommon in some developing countries for there to be long waiting times before applications to Land Agencies are processed. This can be due a number of reasons, a common one being limited processing capacity due to insufficient staff or low productivity. Long waiting times can result in some titleholders no longer using the Land Office (LO) and conducting their land dealings informally. The simple backlog example in Chapters 4 and 5 covered increasing productivity and processing capacity. The expanded example in Chapter 9 covered increasing quality, reputation, winning back lost customers, and financing sustainability of improvements.
Another reason for long delays can be that they are kept artificially high by processing staff to create a market for the payment of informal additional “go fast” (informal) processing fees. This market can arise from two causes. One is that the salaries paid to government employees in a LO can be very low and go fast fees are a way to supplement a salary and thereby gain sufficient to live and support an often extended family. Another cause is that there may be little risk of penalty for accepting go fast fees. This low risk can be because of a lack of strong regulations and procedures to detect and act on go fast fees, and also because managers do not have the skills or willingness to address the issue.
Exiting workflows can also be a contributing factor. They can create several points where go fast fees can be requested by a number of people. This can give rise to a customer paying multiple go fast fees, which in some cases, can be about equal to the formal fee, a severe impost on many customers. This can cause some to no longer use an LO for land dealings.
This example only covers informal go fast fees.
12.0.2 The purpose of this chapter
The purpose of this example is to: -
- Provide an example of performance where a backlog and waiting time is artificially long creating a market for the payment of go fast fees
- Discuss the factors that lead to go fast fees
- Test proposals to negate go fast fees using a SD model
- Discuss the results from “testing” and their implications
12.1 This illustrative example, PIOs, POTs graphs
12.1.1 The story line of this example
Setting – A reasonably large regional “Lands Office” (LO) in a developing country.
The situation now –
Customers/community perspective- The LO has a reputation for “requesting” informal go fast fees from customers to ensure that their applications are processed expeditiously. This has led some titleholders to no longer use the LO.
Staff perspective – The salary paid by the LO is not enough to support a family and contribute to an extended family. Informal fees are a way to ensure a living salary. It is a long standing practise in the LO. Managers know it goes on and take no action. Even if brought to account the likelihood of any action is low, as is any penalty.
Manager’s perspective – Informal fees are a long standing practise, and no action has been taken in the past. Everyone seems to accept it.
Regional government (RGov) perspective - Senior RGov officials are considering undertaking improvements to ensure:- that only official fees are charge; that improved processing workflows are put in place to minimise opportunities for go fast fees to be requested; that it is much easier and quicker to identify where go fast fees might have been paid; that deterrent penalties for noncompliance are put in place, and compliance enforced. A wide awareness campaign for customers, staff and the community is envisaged.
Initiative by management
Senior RGov officials have again retained the services of the IC (incountry) professional, competent in the SD approach to work with them to: -
- gain an understanding of the dynamics of current situation of “go fast” fees
- test a number of proposals to negate speed fees and identify an improvement strategy together with risks
- understand the implications of such an improvement strategy
The senior RGov officials recognise that if an acceptable improvement strategy can be developed it is highly likely that a proof of concept pilot would be necessary, and resultant lessons learnt applied, before any scaling up. It is envisaged that IDA would be required both for the pilot and scaling up.
NB – this is an illustrative example and does not relate to any real situation. Its purpose is to demonstrate the use of the SD approach to examine a not uncommon situations in some developing economies.
12.1.2 The PIOs (performance improvement objectives)
The following PIOs were determined by the IC (in country) SD consultant after discussion with senior RGov officials: -
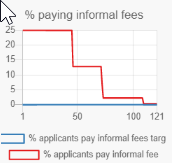
- To significantly reduce the payment of informal go fast fees
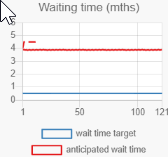
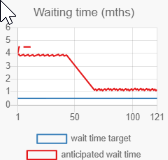
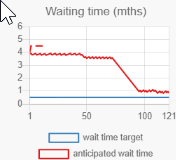
- To keep waiting times and the backlog low
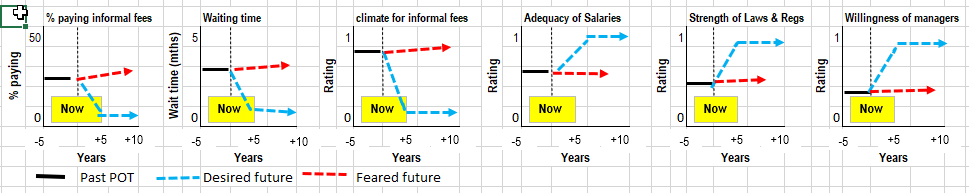
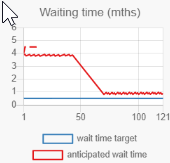
12.1.3 POT graphs of the PIOs and PIs, for past, desired and feared future performances
The Why, Why, Why diagram; Dynamics in play; PIs (performance indicators)
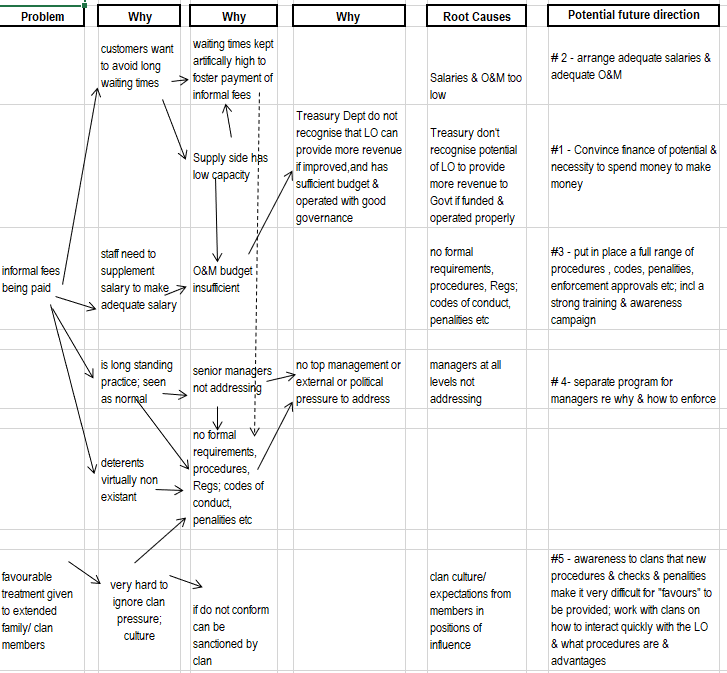
Before developing any graphs for the PIOs a Why, Why, Why, diagram was developed by the local consultant after discussion with staff and managers in the LO and with senior RGov officials. This diagram is shown in Annex A.
The dynamics in play
The story line (Sec 12.1.1) gave an indication of the dynamics and this is reinforced from the Why, Why, Why, diagram. The dynamics can be summarised in a first pass as:-
- Staff feel it necessary to ask for “go fast” fees to supplement what they see as inadequate salaries to live on
- Workflow processes make it relatively easy for staff to ask customers for “go fast” fees at various points along the processing chain
- Staff face little risk of disciplinary action from managers as the practice of accepting “go fast” fees is widespread, long standing and has a cultural dimension
- Managers have a low will and lack confidence to take any action because:- they recognise that salaries are inadequate; the regulatory environment is weak; no actions have been previously taken; they are part of the system; they are not confident on how to proceed; they see little chance of success; there seems to be little political will to change the existing situation
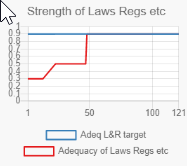
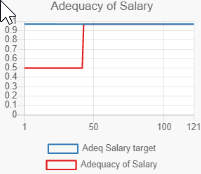
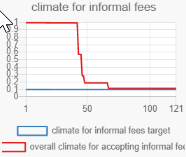
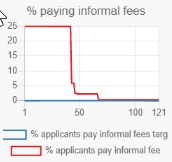
From the above, other PIs, beside the PIOs, were identified as: -
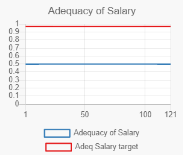
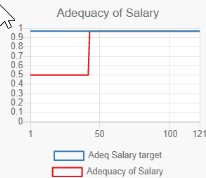
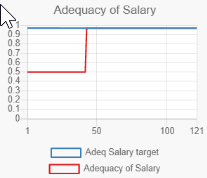
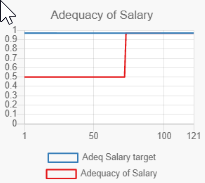
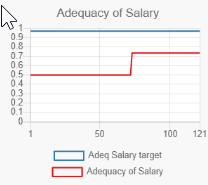
- The Adequacy of staff salaries
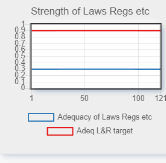
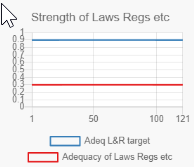
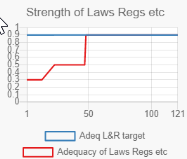
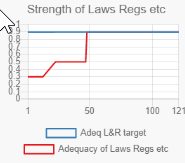
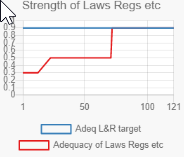
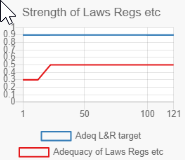
- The Strength of Laws & Regs, procedures etc
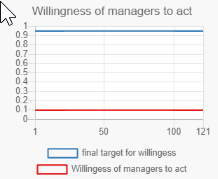
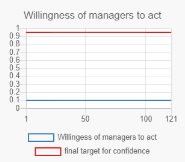
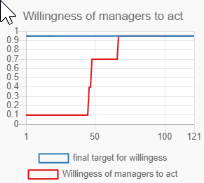
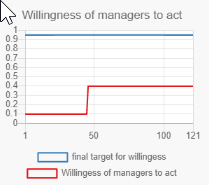
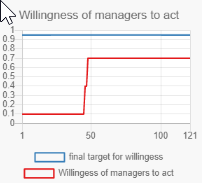
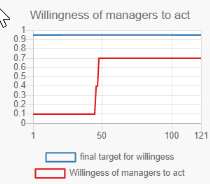
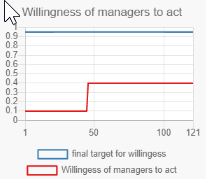
- The Willingness of managers to act against go fast informal fees
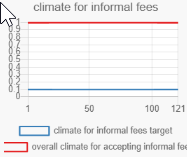
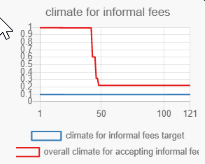
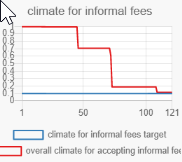
- The Climate for accepting informal fees, flowing from the above
All the above are intangibles with a rating 0-1.
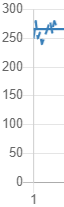
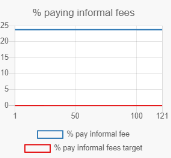
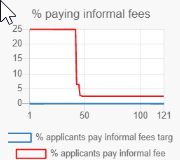
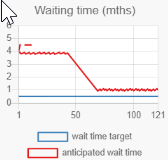
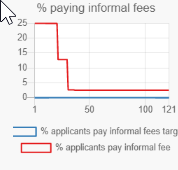
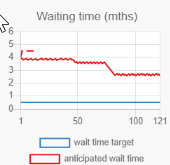
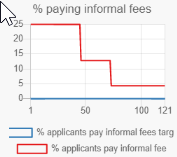
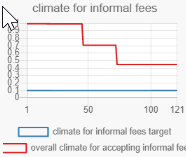
POT graphs for PIOs & PIs
The POT graphs shown in Fig 12.1 were developed by the local consultant working with senior managers.
Fig 12.1
12.2 The System in which performance is to be improved
12.2.1 The system in which performance is to be improved
The system comprises the following have been used in the backlog examples in Chapters 4-7, and of increasing quality in Chapter 9 :-
- A demand side of customers which generates applications for lodgement with the LO
- A supply side of staff which has capacity to process applications
- A supply servicing demand sector where supply process applications from demand
- Feedback loops and graphical functions operating on the above.
For this example the system in which performance is to be improved has additional elements to those used in the previous example. These elements are listed as the first lot of comments under Fig 12.2.
12.2.2 A SCS (schematic of the core structure) of the system in which performance is to be improved
Fig 12.2 provides a first pass of the SCS for this example of the system in which performance is to be improved. The purpose of a first pass at a SCS (schematic of the core structure) has been covered in previous examples.
Fig 12.2
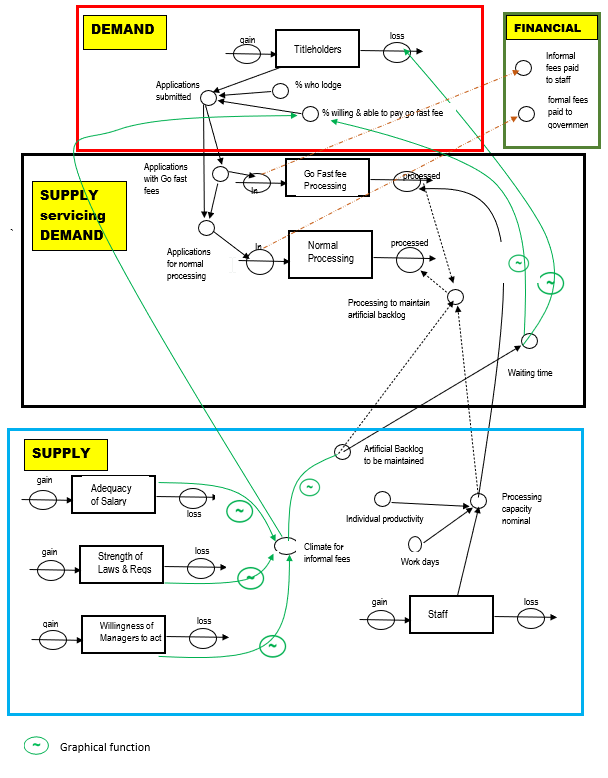
Comments on Fig 12.2
The additional elements to those used in previous examples are:-
- On the demand side- a % of customers who are willing and able to pay an additional “go fast” informal fee
- On the supply side – stocks for:- the adequacy of staff salaries; the strength of Laws & Regs i.e. the regulatory environment; managers willingness to take action against go fast fees. A variable for the climate for informal fees, which is dependent on the three stocks just mentioned
- On the supply servicing demand sector –
- A variable of artificial backlog to be maintained so that resultant long waiting times create a market for go fast fees from applicants who want a quicker service and are able to pay for it.
- An unofficial priority processing lane where applications that have paid a go fast fee are quickly processed. The remaining processing capacity is then available to process other applications, subject to the need to keep the backlog artificially high
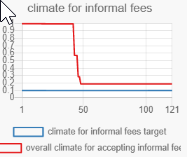
- Graphical functions – There are a total of five. Two are used for the effect that the climate for informal fees has on waiting time (by keeping the backlog artificially high), and another on customers willing to pay an informal fee for faster service. Three are used to relate the three stocks, Adequacy of salary, Strength of Laws & Regs, Managers willingness to act to the variable, climate for informal fees.
12.2.3 What the SCS is indicating,qualitatively,about the dynamics in play
A first pass of the dynamics at play was made in Sec 12.3.1, drawing upon the story line and the Why, Why, Why diagram. An examination of Fig 12.2 confirms those dynamics, and also indicates that:-
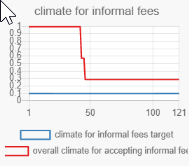
- the vital point to change these dynamics is the climate for informal fees. This is a KPI (key performance indicator). [the desired future trajectory of climate for informal fees was shown in the POT graphs in Fig 12.2].
- change to the climate for informal fees is achieved through increasing the ratings of the three stocks on which the climate for informal fees depends.These three stocks are:- Adequacy of salary; Strength of Laws & Regs; Managers willingness to act
- the PIPs (proposals to improve performance) should be based on increasing the ratings of the above three stocks
12.2.4 The PIPs (Proposals to Improve Performance) of the system
The PIPs
From Sec 12.2.3 immediately above, a first pass at the PIPs produced:-
- Increase the adequacy of staff salaries1 so that staff can’t say they need informal fees to be able to live
- Increase the strength of the necessary laws, regulations, procedures, codes of conduct, workflows, etc, so there is a strong legal and procedural basis for managers to take action
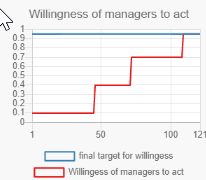
- Increase the willingness of managers to act. Having a strong regulatory environment is one part, but there will need to be adequate training for managers, (incl role playing & the like), to build skills and confidence. Also, there will probably need to be several test cases to show that the accepting of informal fees is being taken very seriously by top management and has political support.
The SCSs of the PIPs
Fig 12.3 shows the SCS of the PIPs and their “connections” to the SCS depicted in Fig 12.2. Several main points follow. Others are given following the figure itself. Main points are:
- There are three subfigures, one for each PIP
- The structure for each subfigure is essentially the same as those used in Chapter 11, Sec 11.3.1, to increase in stages the quality of each of the subcomponents of quality
- The structures for the three PIPs are not independent. Two dependencies are shown in red dashed lines. One is between PIPs 2 and 3 where progress in PIP3, managers’ willingness to act, is dependent on the Laws & Regs of PIP2 being enacted. The other is that the level of adequacy of salary has an effect on the carrying out of example actions by managers. This affects reaching the final target for managers willingness to act. That is, if salaries do not reach a certain level, managers are unlikely to act as all staff will still see that accepting informal fees is necessary to achieve a living wage.
- The story line of this hypothetical example indicates that the IC consultant developed this SCS in consultation with senior managers. In other hypothetical situations the SCS could be quite different.
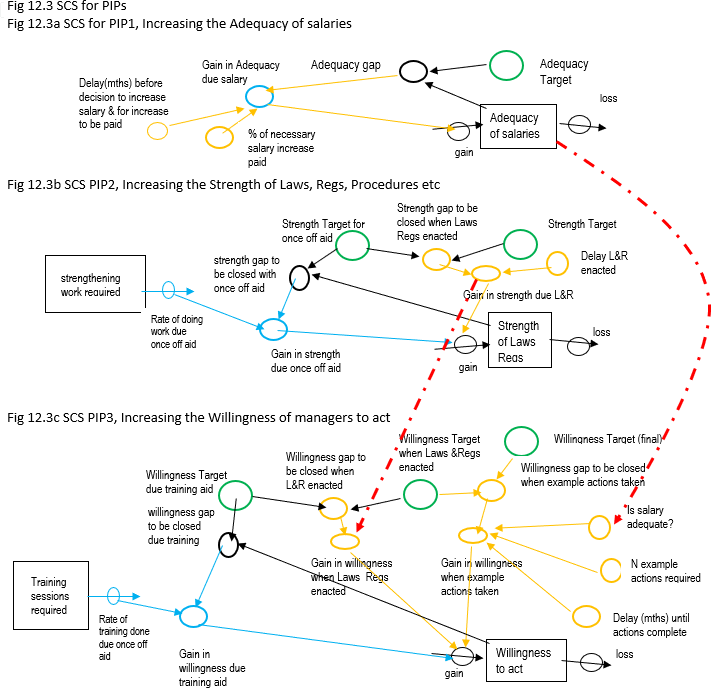
Comments on Fig 12.3
- The colours used have the same meaning as in Chapter 11. Green for targets; black for current situation; blue for aid assistance; yellow for IC (in country action); in above red shows interdependency.
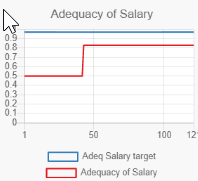
- The three stocks, Adequacy of salary, Strength of Laws& Regs, , Willingness of managers to act, are all intangibles and have a rating 0-1. Initial values of these stocks and target values are shown in Table 12.1
- All 3 PIPs have delays which can be considerable. The effects of these delays on reaching final target values, is shown in the results from the SD model in Fig 12.5. The delays are:-
- For PIP1, Increasing salary, the delay could be 24 mths or longer, given the time taken for agreement to an increase, then for it to be budgeted, and finally to appear in a pay packet
- For PIP2, the delay before draft laws, regs, etc are enacted can mount to years if there is not considerable political will
- For PIP3, the delay for PIP2 applies and there is another additional delay which could be 12- 24 months for the conduct of example actions
- Fig12.3a allows for a less than the necessary salary to be actually paid. This has an effect on the target for adequacy of salary not being fully achieved, and an adverse flow on effect to the climate for informal fees, and the willingness of managers to take example actions.
- Fig12.3b shows an intermediate target for when the strengthening work with aid assistance has been completed, and the final target reached when the Laws & Regs have been enacted and become operational
- Fig12.3c shows two intermediate targets, one for the completion of training and the other for the Laws & Regs (from PIP2) to be enacted. The final target is reached when the example actions are taken and the salary is adequate. If the example actions are less than considered necessary and/or the salary is not fully active, then the final value of the stock, willingness to act, will be less than the target value.
Table 12.1
| Stock | Current Rating | Target Rating | Improvement Work Required | Quality Target with Once-Off Aid Assistance | Specific In-Country Action Required | Delay to Reach Quality Target |
|---|---|---|---|---|---|---|
| Adequacy of salary | 0.5 | 0.97 | Treasury agrees to an increase. | N/A | Treasury approval and implementation of salary increase. | 30 months: 12 months before a decision is made, plus a further 18 months before the increase is paid. |
| Strength of laws, regulations, procedures and related measures | 0.3 | 0.90 | Consultation, drafting and training delivered. | 0.5 once drafting is complete. | Laws, regulations and procedures enacted. | 24 months before laws and regulations are enacted. |
| Willingness of managers to act | 0.1 | 0.95 | Training sessions. | 0.4 after training. | 0.7 when laws and regulations are enacted. 0.95 when example actions are taken. |
24 months before laws and regulations are enacted. A further 18 months before example actions are completed. |
| Climate for informal fees | 1 | 0.1 | N/A — dependent on the three stocks above. | N/A | Dependent on salary adequacy, legal strength and management willingness to act. | Dependent on the timing of improvements to the three stocks above. |
12.2.5 A briefing and discussion session with management
The IC consultant briefed senior management from the RGov and the LO using material so far.
The senior managers asked the IC consultant to:- build a SD model; test the PIPs using scenarios; identify an improvement strategy paying attention to risk management; report on results and implications.
12.3 Building and using the SD model to test the PIPs
12.3.1 Building the SD model
An SD model was developed based on the SCSs of Figs 12.2, 12.3 and data from Table 12.1, with the necessary formulae. This model has a reasonable amount of detail and does not fit on a page, so no image is shown. As noted previously the aim of this book is to show what the SD approach is, how it can be applied and the results obtained, but not to go into the mechanics of model building. If interested in more detail, contact the author at [email protected].
This model is best considered a first pass at a working hypothesis. It can be modified during the conduct of the pilot (assuming one is undertaken) as a lot more real world data becomes available.
12.3.2– Showing that the SD model can replicate past POT
The local consultant was able to determine indicative estimates for actual past POT for the last 12 months for:- applications submitted; applications fast tracked (assumed a go fast fee had been paid); applications processed normally; waiting time for normal processing. Fig 12.4 shows a comparison between actual past POT and the model trajectory for the past 12 months. Actual data is the blue dashed line and model trajectory is the blue solid line.
Fig 12.4
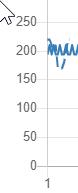
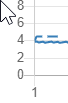
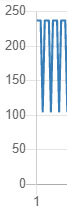
It can be seen that there is an approximate agreement between model data and actual data. This gives some confidence in the model.
12.3.3 Scenario to be tested for effectiveness and sustainability and results
Table 12.2 lists the scenarios used in a first pass to examine for effectiveness and sustainability.
Table 12.2
| Scenario | PIPs | Detail |
|---|---|---|
| Base Case | N/A | The provincial Lands Office continues as is. |
| Scenario #1 | PIPs 1, 2 and 3 fully combined | Salaries are adequate, laws and regulations are strong, and managers are willing to act on informal fees. |
| Scenario #2 | PIPs 1 and 3 partly combined | Salaries are adequate and managers are willing to act on informal fees, but laws and regulations are not strengthened. |
| Scenario #3 | PIPs 1, 2 and 3 combined | Salaries are increased to 70% of the required level, but are not fully adequate. Laws and regulations are strengthened, and managers are willing to act on informal fees. |
| Scenario #4 | PIPs 1, 2 and part of 3 combined | Salaries are adequate and laws and regulations are strengthened, but managers do not take example actions. |
| Scenario #5 | Scenario #1: PIPs 1, 2 and 3 combined | All delays are doubled. |
| Scenario #6 | Only part of all PIPs carried out | Salaries are increased to only 50% of the required level. Laws and regulations are drafted but not enacted, example actions are not taken, and delays are doubled. |
Comparing scenarios results by examining for each, KPI, PIOs, PIs
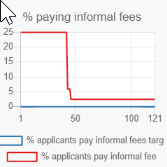
The performance trajectories for each scenario from the model for the KPI, PIOs and PIs are shown in Fig 12.5. Targets are included where they have been set. The blue lines show target values and the red line future performance trajectories generated by the model.
Fig 12.6 Scenario comparison
Base Case: - the provincial Land Office Continues AS IS.
Scenario #1:- PIPs 1,2,3 FULLY combined [salaries are adequate; Laws & Regs etc are strong; Managers are willing to take action on informal fees]
Scenario #2: - PIPs 1,3 combined: [salaries adequate; Managers willing to take action on informal fees; Laws & Regs etc NOT strengthened; PIP2]
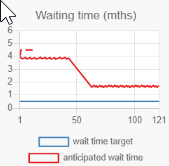
Scenario # 3: -PIPs 1,2,3 combined [salaries increased BUT NOT fully adequate; Laws & Regs etc strengthened; Managers willingness to take action
Scenario # 4: - PIPs 1,2, & part 3 combined: [salaries are adequate; Laws & Regs etc strengthened; managers do NOT take example actions PIP3]
Scenario # 5: -Scenario #1 (PIP 1,2 3, combined): [but all DELAYS doubled]
Scenario #6: Only part of all PIPs carried out: [salaries only increase to 50%; Laws etc drafted but not enacted; example actions not taken; Delays doubled]
12.3.4 Comments on Scenario results
Base case-- the provincial Lands Office Continues AS IS.
No indicator reaches its target. The payment of informal go fast fees continues. There are considerable gaps to close for all indicators to reach their desired targets.
Scenario#1: PIPs 1,2,3 combined (Salaries adequate; Laws & Regs etc strong; Managers willing to act on informal fees)
All indicators reach their targets. The KPI, climate for informal fees, reaches its very low target value incrementally ~ 55 months after NOW, when improvement action commences. All other indicators also reach their targets, albeit at different times. Managers’ willingness to act takes the longest time to reach its target due largely to delays and dependencies on other PIPs as illustrated in Figs 12.3 and 12.6. This is the best case.
Scenario #2: PIPs 1,3 combined(salaries are adequate; Manager’s willingness to act on informal fees) [Laws & Regs NOT strengthened; PIP2]
The single KPI and the two PIO targets have not been reached. Only one of the three PI targets has been reached, that of the adequacy of salaries. The reason that the targets have not been reached is that no action has been taken to strengthen the Laws & Regs (PIP2), and this also affects, through interdependency, the attainment of the targets for PIP3, managers willingness to act. Fig 12.3c refers.
Scenario #3: -PIPs 1,2,3 combined (BUT salaries increased to only 50% of that requested by staff; Laws & Regs etc strengthened; Managers willing to act on informal fees )
The KPI is reduced but does not quite reach its target. The two PIOs are improved but also do not reach their targets. Only one PI, strength of Laws & Regs, meets its target. The PI, adequacy of salaries, does not reach its target because salaries have only been increased to 50% of what staff consider necessary. The PI, managers willingness to act, does not reach its target value as it is affected, through interdependencies, by the adequacy of salary.
This scenario illustrates the balancing act between what salary is adequate to live on, (illuminating the need to take informal fees), and the willingness of managers to act against accepting informal fees together with staff fears of the penalties. As noted previously, this model so far is best considered as a working hypothesis and probably does not yet fully represent the real world.
Scenario #4: – PIPs 1,2, & part 3 combined: [salaries are adequate; Laws & Regs etc strengthened; managers do NOT take example actions PIP3]
The KPI is reduced but does not quite reach its target. The two PIOs are improved but also do not reach their targets. The PI, managers willingness to act, reaches two stages towards its targets but not the final target, as managers are unwilling to take some example actions against the acceptance of informal fees. This is recognised by staff so full deterrence is not achieved. The other two PIs reach their targets.
Scenario #5: -Scenario #1 (PIP 1,2 3, combined): [but DELAYS doubled]
All indicators reach their targets, but much later than in Scenario #1. The KPI, climate for informal fees does not reach its target until ~45 mths later than Scenario #1. This is ~100 months after NOW, the commencement of the improvement endeavour.
Scenario #6: - Only part of all PIPs carried out: [salaries only increased to 50% of need; Laws & Regs etc drafted but not enacted; example actions not taken; Delays doubled]
All indicators miss their targets by a considerable amount. This is the worst case.
Overall conclusions from the Scenarios
The following overall conclusions can be drawn:-
- Scenario #1, the three PIPs combined, is the most effective as all targets are achieved. This is the best case of all the scenarios.
- In order to have a have a significant effect on reducing the climate for informal fees, the KPI, ratings for all three PIPs need to be considerably increased to reach close to their target values, because of interdependencies between the PIPs
- Several scenarios indicate the difficulty in fully negating go fast fees by targets not being achieved, or by taking so long that will and focus will probably be lost
- There is a delicate balancing act between what constitutes adequate staff salaries so that accepting informal go fast fees cannot be deemed as necessary to be able to live adequately (staff, managers and customers may have differing views), and the risk of deterrent penalties from managers willing to act.
- There are risks with an improvement endeavour to negate informal go fast fees
12.4 Improvement Strategy, Risk Identification and Mitigation
12.4.1 The improvement strategy from testing the PIPs/Scenarios
The improvement strategy is thus based on implementing PIPs1,2 and 3 together. Some fine tuning will be necessary after a consideration of risks and their mitigation.
12.4.2 Risk identification, What Ifs, risk mitigation
Risk Identification
As this is part of the first pass only major risks have been identified and are shown in Table 12.3
Table 12.3
| Risk | Likelihood | Qualitative Effect |
|---|---|---|
| Risk #1 The salary increase provided is seen as insufficient by staff. |
High | The acceptance of informal fees may be reduced but will continue, particularly if the risks of serious penalties are low. |
| Risk #2 Laws, regulations, procedures and related measures are drafted but not enacted and operationalised. |
Medium | The regulatory and procedural basis is not strong enough to detect the payment of informal fees or act as a deterrent. |
| Risk #3 Management takes no example actions, or the actions are not successful. |
Medium | The risk of effective action will be seen as low, and the acceptance of informal fees will continue. |
| Risk #4 The various delays are much longer than anticipated, including delays for salary increases to be paid, legislation to be passed, and example actions to be taken by management. |
High | Delays are so long that impetus is lost, and the issue of informal fees is viewed as not being taken seriously. |
| Risk #5 All of the above happen concurrently. |
Medium | All effects occur in a nonlinear way. |
What Ifs and what they indicate (quantitatively)
A list of What Ifs, based on the risks listed in Table 12.3, could be drawn up and run through the SD model, similar to the first backlog example (Sec 5.5.2 refers). In the case of this example this has essentially already been done, sufficient for a first pass, when testing the various PIPs for effectiveness and sustainability with the results shown in Fig 12.5. Table 12.3 comments on each risk, drawing on the quantitative POT graphs in Fig 12.5.
Table 12.4
| Risk | Quantitative Impact of Risk |
|---|---|
| Risk #1 Salary paid is seen as insufficient. |
Graphs and comments for Scenario #3 in Fig. 12.5 refer.
|
| Risk #2 Laws, regulations, procedures and related measures are drafted but not enacted and operationalised. |
Graphs and comments for Scenario #2 in Fig. 12.5 refer.
|
| Risk #3 Management takes no example actions, or the actions are not successful. |
Graphs and comments for Scenario #4 in Fig. 12.5 refer.
|
| Risk #4 The various delays are much longer than anticipated. |
Graphs and comments for Scenario #5 in Fig. 12.5 refer.
|
| Risk #5 All of the above happen concurrently. |
Graphs and comments for Scenario #6 in Fig. 12.5 refer.
|
Conclusions
- The risks are interdependent due to the structure of the SCS of the three PIPs (Fig 12.3 refers) and must be managed together
- Success (the KPI and the two PIOs achieving or nearly achieving their targets) depends on all the three PIs reaching or nearly reaching their target values
- It can take considerable time for Success to be achieved because of the structure of the SCS for the three PIPs. In the best case, scenario #1, Success is achieved ~55 mths after the improvement effort commences. Success occurs some considerable time after aid ceases. If delays are doubled (scenario #5) then Success is achieved ~ 100 mths after the improvement effort commences. In the worst case, scenario #6, no indicators achieve their targets by a considerable amount
- The results from the scenarios and risk analysis are not predictive. As stated previously, the SCSs and the model are best considered as a working hypothesis to gain a reasonable understanding of the dynamics in play and to identify an improvement strategy. As noted in Chapter 9 Sec 9.6 there comes a point when it is necessary to “start doing”, to use the model as a LBM (living business model) and modify the SCSs and SD model to reflect reality, using real world data collected during M&E&A (monitoring and evaluation and action).
- Achieving success in this situation (the story line) is likely to be quite difficult as accepting informal go fast fees has been going on for a long time, change may not be welcome and may be resisted. If all improvements are put in place, but managers are not willing to act, then the success is not likely to be achieved. (scenario #4 refers).
- Drawing on the above the Critical Success Factors (CSFs) can be identified as:-
- Increasing staff salaries sufficiently for staff to support a family, and staff being willing to not take informal fees
- The passing of necessary laws and regulations, procedures etc to provide the legal basis for deterrence and action, and the improvement of workflow to reduce “potential payment points” and to make the detection of possible informal fee payments easier
- Striking the correct balance between sufficient staff salary increases and the deterrence of the likelihood of penalties to very significantly reduce informal fees
- The showing of strong will by senior officials, with political support, to take action against cases where informal fees are proven to have been taken
12.4.3 Improvement strategy including risk mitigation
The improvement strategy, now including risk mitigation is:-
- Implementing PIPs1,2 and 3 together
- Conducting a broad awareness campaign for customers, staff and the community against the payment of informal fees
- Carrying out monthly M&E&A and using the model as an LBM to track progress, modifying it as necessary, and using it to revise performance trajectories (as shown in Chapter 9 Sec 9.7.4)
- Focusing on achievement of the four CSFs
- Senior executives in the Provincial Government to convince :-
- Politicians of the necessity to pass the draft legislation
- Treasury of the necessity to approve wage increases (drawing upon the example in Chapter 9 which showed how this could be financed and also result in increased revenue to government)
- Senior managers in the Lands Office of the necessity to take action, once all the enablers are in place
- Carry out a 6 & 12 mth review with the aid donor to examine progress towards “success” and being prepared to redesign the whole improvement endeavour if the situation is found to be markedly different from that in the story line, or the situation changes markedly
12.4.4 Gantt Chart– First Pass
Fig 12.6 is an indicative Gantt (not to scale) of main events based on the improvement strategy, and scheduling anticipated delays to maximise the flow of improvement activities.
Fig 12.6
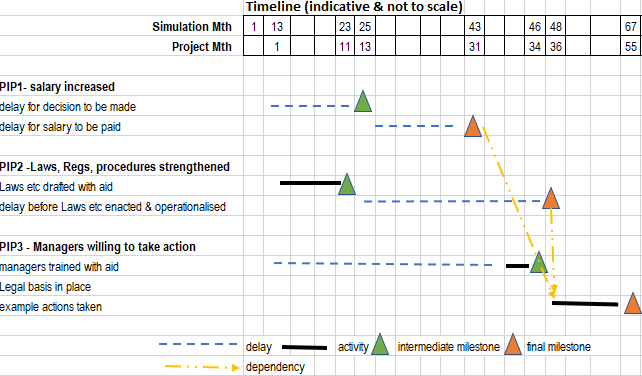
Comments on Fig 12.6
- The impact that delays have (the dashed blue lines) can be clearly seen
- Most delays are waiting for decisions to be made or actions to be taken IC and require only a small amount of resources. However a decision or action by senior management is required. The effect of not taking decisions/actions was illustrated in scenarios #2, 3, 4, 6.
- Targets would be achieved much quicker if the delays could be halved
12.5 Provincial Government decision re implementing the improvement strategy
The story line of this example
The storyline of this example (Sec 12.1) was that senior provincial government officials wished to see that customers paid only authorised fees, and that the payment of informal fees curtailed. The officials decided to use the IC consultant who had successfully worked with them before using the SD approach, to determine the improvement strategy for staff development (example of Chapter 10 refers). The consultant was required to work with senior provincial government officials to:-
- Gain an understanding of the dynamics of current situation of “speed fees”
- Test proposals to negate speed fees and identify an improvement strategy together with risks
- Understand the implications of such an improvement strategy
The senior provincial officials recognised that if an acceptable improvement strategy could be developed it was likely that a proof of concept pilot would be necessary and resultant lessons learnt and applied before any scaling up to other land offices. It was envisaged that IDA would be required both for the pilot and the scaling up.
What was done in this hypothetical example
The IC consultant, worked with provincial and LO managers to :-
- Progressively identify the dynamics in play (Secs 12.1.3, 12,2,3) and the SCS (or system schema) that explained performance (Sec 12.2)
- List three proposals to negate go fast fees ( Sec 12.2.4), built an SD model to test the proposals (Sec 12.3), and determine an improvement strategy including risk management (Sec 12.4.3)
- Develop a high level Gantt chart of key improvement activities and milestones (Sec 12.4.4)
Subsequently officials were briefed on findings with particular attention paid to risks and their implications for success. The consultant also reported that a climate for informal fees had a serious negative effect on the integrity of operations, subcomponent of quality. This affected (with other sub components of quality) the overall quality of tenure security (Chapter 11 example). The effect on economic development by the ability to use titles as loan collateral is examined in Chapter 13. The point was made that if the medium/long term aim of the provincial government was to increase tenure security, and to see titles used as collateral for development capital, then informal fees needed to be negated.
Provincial senior management considerations and decision
Considerations
Recognised that negating informal fees was likely to be difficult and with risks, but should be done in its own right and because of the mid/long term aim to increase tenure security, and also to see a much wider use of titles as collateral for development capital
Decisions
- That a proof of concept pilot be carried out based on the identified improvement strategy and high level Gantt chart, and that lessons learnt be incorporated. Strong attention to be focused on the four CSFs.
- The pilot would be reviewed with a view to scaling up to other LOs.
- That the IC consultant amend the SD model to include inputs and costs to conduct the pilot.
- That once resources and costs were estimated, discussions to begin with potential aid donors
NB
- This example will be taken no further as the purpose of this chapter has been achieved. (Sec 12.0.2 refers).
- Examples of costing a project, undertaking a project evaluation, and using the SD model as an LBM have been shown in some of the previous examples.
12.6 Value of this example, things that could be included, and used elsewhere
The value of this example
The value of this example is:-
- It addresses the problem of informal fees where improvement efforts to negate them can be risky
- It provides an example where improvements occur in stages, the PIPs are interdependent, and to achieve Success (the KPI & PIOs reach their target values) the performance gap in all PIs have to reach, or nearly reach their targets
- As in previous examples, much can be learnt from sketching SCSs for the system where performance is to be improved and the SCS of the PIPs together with POT graphs
- As stated for previous examples, the important point is not the results from this example but the use of the SD approach, which is logical, quantitative and transparent, with no implicit assumptions or hidden hard wiring. If the logic and structure of the SCS or the structure of the SD model is not appropriate for other situations, then it is relatively simple to develop an alternative SCS and SD model and use them instead.
Some things that could be included in this model
The following could be added to the model if desired; –
- decay rates (outflows) for the three PI (adequacy of salary, strength of laws and regs, managers willingness to act) and the required inflow and costs to maintain the three PIs at their target values2
- an annual increase in applications submitted
- the go fast processing lane for when informal fees were paid, could be transformed into a formal fast processing lane where an additional formal fee has been paid
- the provisional of preferential treatment, without the payment of an informal fee, due to clan/tribe pressure
- percent of nominal processing capacity used
- a comparison of applications submitted, and the backlog compared to nominal processing capacity
- an estimate of the amount and cost of aid assistance to carry out the designated tasks
- the percent that informal go fast fees are estimated to be of the formal fees
- the structure for the wide awareness campaign against the payment of informal fees. This is aimed at staff, customers and the community using the using the structure of not aware, aware, informed, that was described in chapter 9, Sec 9.4.1 for winning back titleholders who were no longer using the LR (land registry)
While all the above could be included in the model, the model as it stands brings out the basic structure of go fast informal fees, its dynamics, and the likely impacts of various PIPs to negate these informal fees.
How the model of this example can be incorporated into the models of previous examples
There are several ways this model could be used in some of the previous examples where appropriate.
- The climate for informal fees could be treated as one of the subcomponents of quality internal to the LR or as part of the subcomponent, integrity of operations, in the example of Chapter 11. [Chapter 11 also indicated how the various subcomponents of quality could be incorporated into the broader example of Chapter 9 where overall quality and reputation were increased, lost titleholders won back, and sustainability of improvements financed.]
- The structure for the fast processing of applications where go fast fees have been paid could be incorporated into the example of Chapter 9.
NB
If the above was incorporated into the model of Chapter 9, and if the actions to decrease he climate for informal fees were not taken, then this would act as a serious brake on increasing quality and reputation and through feedback and the structure of the model, would seriously affect the achievement of the desired future trajectories of a number of PIO of the Chapter 9 example.
12.7 Key Points
- This hypothetical example required the determination of an improvement strategy, with risk mitigation included, to negate informal go fast fees. Senior provincial government officials required this strategy so that they could consider the merit of undertaking a pilot to negate the informal go fast fees. Their view was that lessons learnt from the pilot could then be applied in a scaled up roll out.
- Seeking to negate informal fees as an improvement endeavour has risks. The risks can be understood, tested, mitigated and included in the improvement strategy using the SD approach.
- The process of collaboratively hand drawing a SCS (schematic of the core structure) for the system to be improved and the PIPs (proposals to improve performance), makes one think deeply about the structure of the system, the dynamics in play, and the likely qualitative effects of proposed interventions. An SD model based on the SCS allows the quantitative exploration of scenarios.
- This example showed the staged progress of each PIP, the adverse effects that delays can have, and the effects of interdependency between the PIPs. Scenarios examined the likely results from various PIP combinations and situations. Several scenarios showed that success, the achievement of target values, would be highly unlikely. This facilitated the identification of an improvement strategy and the associated risks. CSFs (critical success factors) were identified.
- The results from the scenarios and risk analysis are indicative and not predictive as the SCS and the model are best considered as a working hypothesis at this stage. There comes a point when it is necessary to “learn by doing” (i.e. undertake the pilot). This would involve using the model as an LBM (living business model) and modifying the SCSs and SD model to reflect reality, using real world data collected during M&E&A (monitoring and evaluation and action). The modified model would be very useful in planning the scaled up rollout.
- The senior provincial government officials recognised that negating informal go fast fees was likely to be difficult and with risks, but should be done in its own right because of the aim to increase the quality subcomponent of integrity LA operations, and hence increase reputation and tenure security, and the mid/long term to see a much wider use of titles as collateral for development capital.
- As in previous examples, this example and the results shown, are not the most important part. The important aspect is how the SD approach can be used. If the logic and structure of the SCS or the structure of the SD model is not appropriate for a particular situation, then it is relatively simple to develop an alternative SCS and SD model and use them. The most important point is that the SD approach is logical, quantitative and transparent, with no implicit assumptions or hidden hard wiring.
ANNEX A
The Why, Why, Why diagram
ANNEX B
| Abbreviation | Meaning |
|---|---|
| CSF | Critical Success Factor |
| IC | In-Country |
| IDA | International Development Assistance |
| KPI | Key Performance Indicator |
| LBM | Living Business Model |
| LO | Land Office |
| LR | Land Registry |
| M&E&A | Monitoring, Evaluation and Action |
| PI | Performance Indicator |
| PIO | Performance Improvement Objective |
| POT | Performance over Time |
| PIP | Proposal to Improve Performance |
| RGov | Regional Government |
| SCS | Schematic of the Core Structure |
| SD | Strategy Dynamics |
Footnotes
- 1 There may be other options instead of cash increases such as contributing to school fees, medical coverage & similar. In some circumstance considering a public private partnership may provide more flexibility. ↩
- 2 This should be included in the second pass of the model to examine the what is required for sustainability; i.e. keep the climate for informal fees low and at target value. ↩