CHAPTER 10
STAFF DEVELOPMENT:
BUILDING SKILLS and INCREASING WORK CAPACITY
10.0 Introduction
10.1 This illustrative example, PIOs and POTs
10.1.1 The storyline of example
10.1.2 The PIOs (performance improvement objectives)
10.1.2 POT (performance over time) graphs of the PIOs
10.2 The system where performance is to be improved
10.3 Some system building block structures used in staff development
10.3.1 A staff development chain
10.3.2 Staff have skills that travel with them
10.3.3 Staff receive salaries that also travel with them
10.3.4 Skill levels affect work capacity and work done; Morale is important
10.4 The SCS of the system where performance is to be improved
10.4.1 The SCS of the system whose performance is to be improved
10.4.2 What the SCS is indicatingqualitativelyabout the dynamics in play with no IDA
10.4.3 The PIPs (Performance Improvement Proposals) and indicative inputs
10.5 Building and using the SD model to test the PIPs
10.5.1 Building the SD model
10.5.2 Showing that the SD model can replicate past behaviour
10.5.3 Testing each PIP for effectiveness and sustainability
10.5.3.1 Stage 1 testing
10.5.3.2 Stage 2 testing
10.5.4 Overall comments on the model
10.6 Improvement Strategy, Risk Identification and Mitigation
10.6.1 The improvement strategy from testing the PIPs
10.6.2 Risk identification, What Ifs, risk mitigation
10.6.3 The improvement strategy including risk mitigation
10.7 Financials, Evaluation, Decision to implement the improvement strategy or not
10.8 Using the SD model as Living Business model to assist M&E
10.9 What this example showed, its value, things that could be included
10.10 Key Points
Tables
10.1 First pass at indicative inputs for PIPs
10.2a Reasons for two stage testing
10.2b PIOs used in stage 1 testing
10.3 Comments on results of stage 1 testing
10.4 The improvement strategy including risk mitigation
10.5 Activities to increase skill levels and their PIs
10.6 The PIs, KPIs and PIOs that need the closest and regular M&E
Figures
10.1 POT graphs of the PIOs
10.2a The staff development chain
10.2b Staff have skill attributes
10.2c The staff and skill pipeline
10.2d The staff, skills and salaries pipeline
10.2e Supply, Demand, Supply servicing demand structure
10.3 First pass at SCS (schematic of the core structure)
10.4 SCS with PTIPs
10.5a Results of stage 1 testing each PIP separately
10.5b Results of testing the combination of PIP#1,2,5
10.6 Results of Stage 2 testing - fine tuning PIP#1,2,5
10.7 SCS showing KPIs and PIs
Annexes
A. Why, Why, Why diagram
B. Sketches of indicative effects of graphical functions
C. Abbreviations used
CHAPTER 10
STAFF DEVELOPMENT:
BUILDING SKILLS and INCREASING WORK CAPACITY
10.0 Introduction
Context
Integral to IDA (international development assistance) projects in LA (land administration) is staff development, increasing incumbent skills, individual and team productivity. Maintaining high skill levels post IDA is essential to sustainability. While the framework for maintaining skill levels can be established during an IDA project, the responsibility for maintaining them post IDA lies with the local agency.
At one end of the scale, increasing skills may only involve increasing a small number of skills of a small number of staff, as in the first example of a backlog in an LR. At the other end of the scale a large training program may be necessary for a large scale IRPR (initial recording of property rights) undertaking would involve a range of different skills, e.g. community awareness and engagement; rights identification and recording; boundary identification and recording; community verification and adjudication; certification and issuance; need for recording changes in rights held. In some instances a lot of the personnel joining the training program will have little or no knowledge of the skills, and the training programs may be reasonably long with moderate dropout rates.
The example in this chapter, that of staff development, deals with the challenges of evaluating possible ways to increase staff skills and then maintain them, so that individual productivity and total work capacity are increased.
The purpose of this chapter
- To outline the main structures for staff development using the SD (Strategy Dynamics) approach
- To show how the SD approach can be applied to:-
- Design staff development programs
- Increase the skill levels of staff already working in a land office
- Train new staff to join an existing work force
- Increase staff skill to increase work capacity and morale
- Test PIPs (performance improvement proposals) for effectiveness and sustainability
- Determine an improvement strategy
Acknowledgement
This chapter draws on Dr Kim Warren’s learning materials and models from his online SD extensions course, particularly those segments dealing with staff development. This is gratefully acknowledged. Any errors are the authors.
10.1 This illustrative example, PIOs and POTs
10.1.1 The setting and situation
Setting – a reasonably large regional “Lands Office” in a developing country with a staff of ~60 (40 junior and 20 senior)
The situation now –
- These 60 staff hold a number of different types of positions (field land officers, office land officers who can deal with different types of tenure, LR staff)
- Staff can be classified as either junior or senior, depending on skill, experience and seniority. Salary is dependent on classification
- Three new hires are made every three months as juniors. They have no relevant land office skills. Training is largely informal and most knowledge is gained by observing other staff.
- Staff turnover is reasonably high for a number of reasons; some juniors get a few skills and leave for something better; some younger staff leave for the bright lights of the capital; some juniors drop out due to lack of interest or poor on the job training; some competent experienced staff leave for better paying jobs in the region or from frustration at having “to hold the hands” of low skilled and inexperienced junior staff. Staff who don’t leave eventually become seniors as vacancies occur
- Junior staff are thought, on the average, to have 3 of 5 required skills, while senior staff have an average of 6 of 10 required skills
- The above is causing the office to function below the expectations of senior provincial officers. Errors are occurring in processing which are questioned by customers and result in reworks, which further lowers processing capacity. Individual productivity is thought to be decreasing as skills decay, and new staff have fewer skills than staff leaving. Staff turnover is considered too high.
Initiative by management
The senior provincial officers have engaged a staff development specialist with SD skills to advise on ways to improve the current situation.
NB – this is a hypothetical illustrative example and does not relate to any real situation. Its purpose is to illustrate the SD approach to addressing not uncommon staff development situations in developing economies.
10.1.2 Identifying the PIOs (performance improvement objectives)
After discussion with senior provincial and land office managers the following PIOs were determined.
Primary PIOs
- To increase average skill levels for junior and senior staff to close to designated targets
- To reduce the amount of rework
- To keep any backlog and waiting time low
- To increase work skills that result in increased work capacity
- To have a better system for the development of staff and their skills
- To reduce the % of staff who leave annually
Other PIOs
- To not increase total staff numbers
- To avoid increasing the cost of salaries if at all possible
- To increase morale
The above are multiple PIOs. The previous example in Chapter 9 was the first example of seeking to achieve multiple PIOs.
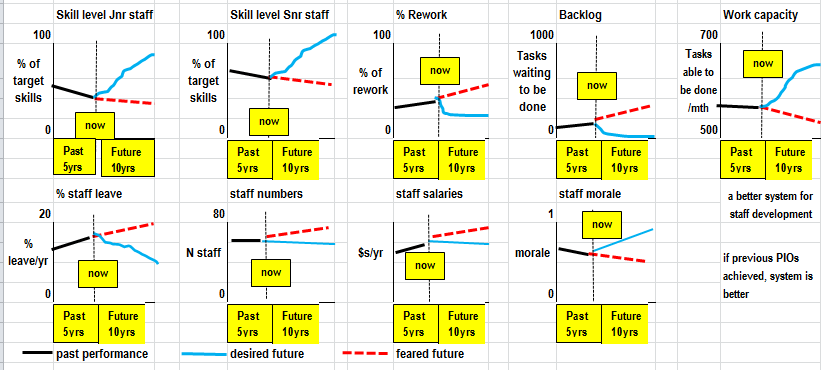
10.1.2 The POT graphs of the PIOs for past, desired and feared futures performance
Fig 10.1
The Why, Why, Why diagram and preliminary observations of the dynamics in play
The Why, Why, Why, diagram is shown in Annex A. The problem of high rework rates, low morale and high turnover seems to be due to overall low skill levels, this in turn is due to no/little formal training or guidance being provided.
10.2 The System where performance is to be improved
The system comprises the following:-
- A demand side of tasks submitted by customers for processing/approval by the LR
- A supply side of the land office, including:- staff types; how new staff enter the system; how staff are skilled and promoted; individual productivity and group work capacity; how skill levels affect productivity, work capacity, the amount of rework, backlogs, morale and staff leaving;
- A supply servicing demand side where supply aims to meet demand
The focus of this example is staff development so this mainly affects the supply side.
Before sketching a SCS (schematic of the core structure) of the system , some system building blocks used in staff development will be examined.
10.3 Some system building block structures used in staff development
The purpose of this section is to introduce the structure of some SD building blocks that can be used in staff development. They will be applied, in whole or part, when sketching the SCS and building the SD model.
10.3.1 A staff development chain
Staff can have different classifications, e.g. trainees, juniors, seniors etc . Fig 10.2a shows a possible staff development chain.
Fig 10.2a
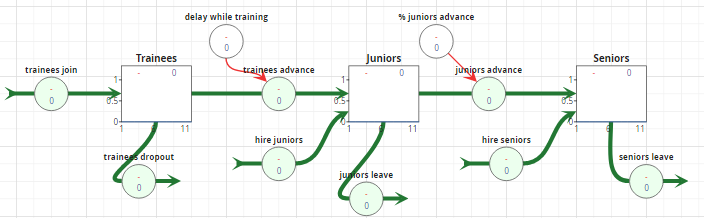
Comments on Fig10.2a
- The mechanics of stocks and flows, as explained in Chapter 4, apply.
- There are three stocks in the chain, trainees, juniors, seniors, which depict three mutually exclusive classifications of staff
- Trainees have one inflow, trainees join, and two outflows, traineesdropout and trainees advance. In the latter outflow, after a delay while training those who have not dropped out join the junior staff.
- Juniors have two inflows, those who advance (after completing training) and new staff who are hired as juniors (they already have some skills or experience). Juniors also have two outflows juniorsleave and advance. (a % of juniors are deemed to have the necessary skills to be classified as seniors.)
- Seniors have two inflows, juniorsadvance and hire seniors and one outflow, seniorsleave
- The red lines in Fig 10.2a indicate that the link is illustrative and that not all links/variables necessary for computation have been included
- In the storyline of this example (Sec 10.1) there is no such group as trainees, and all new staff enter as juniors with no skills. Trainees will be introduced as a PIP (performance improvement proposal) in Sec 10.4.3
10.3.2 Staff have skills that travel with them
Skills are an attribute1 of staff. As staff move through the various classifications their skills move with them.
Fig 10.2b
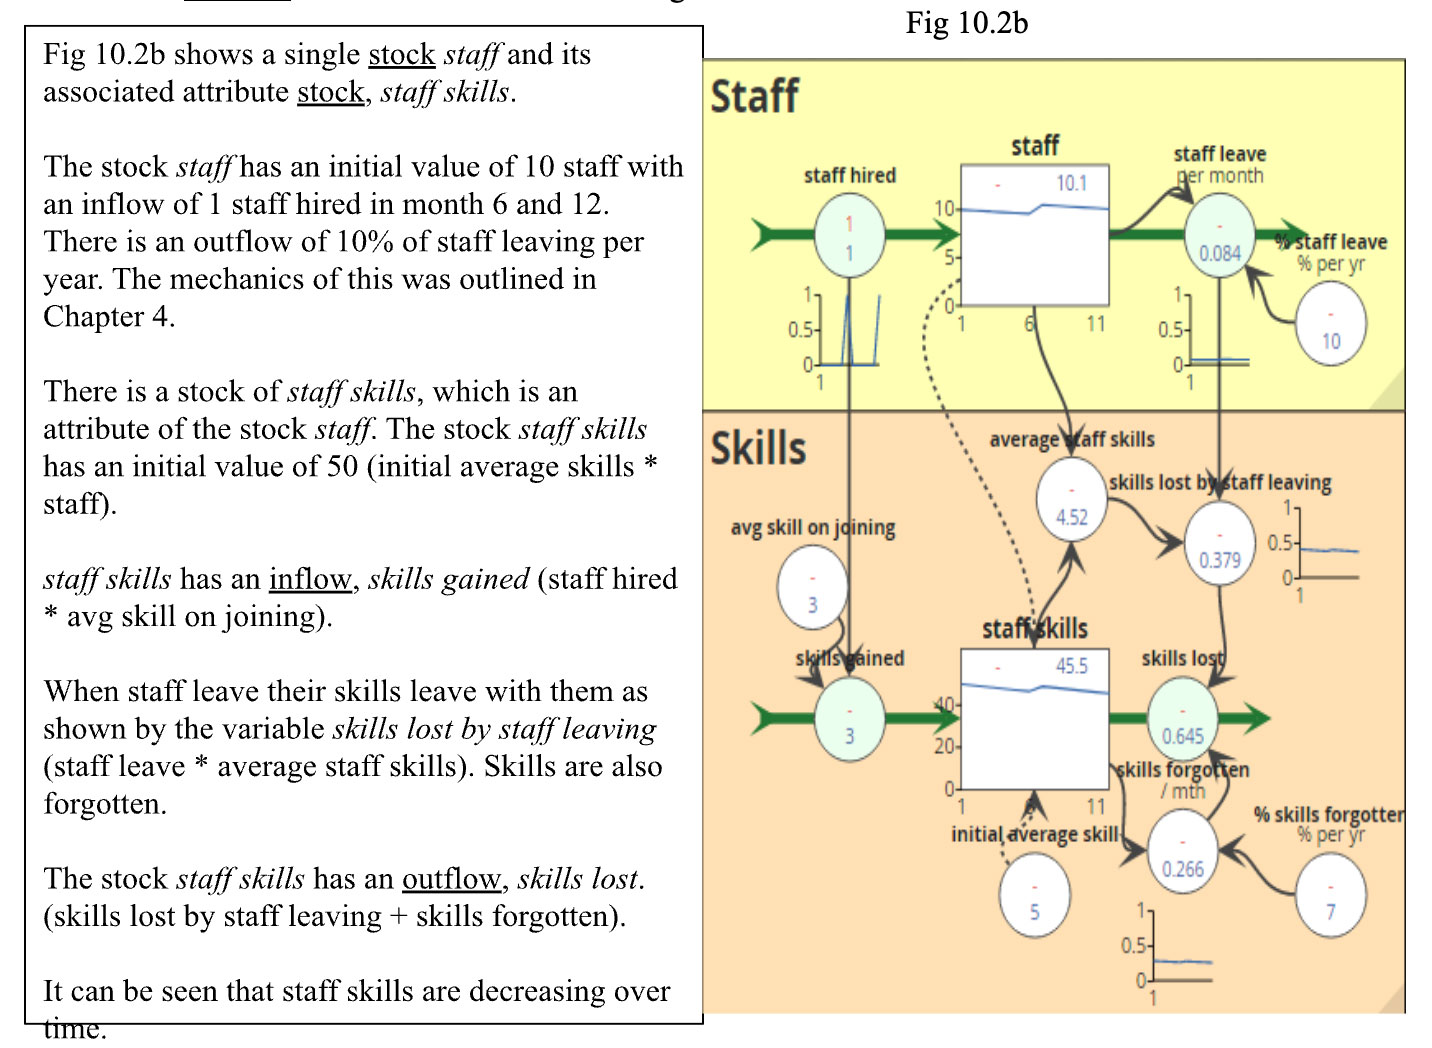
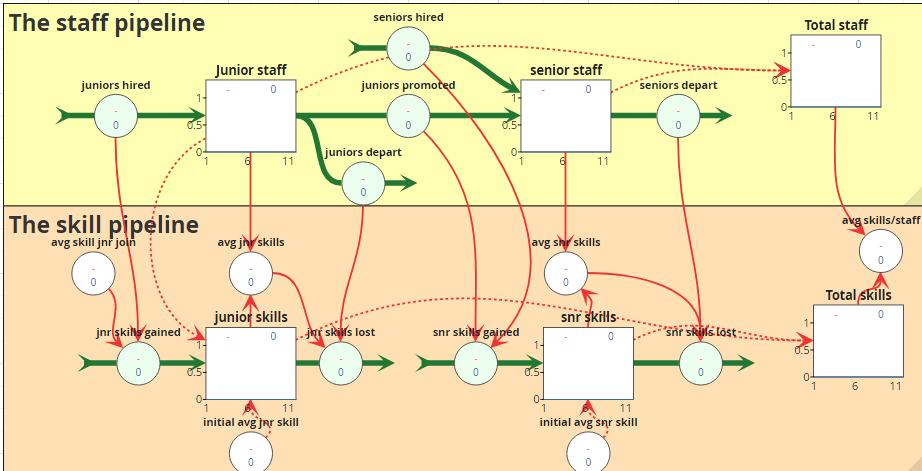
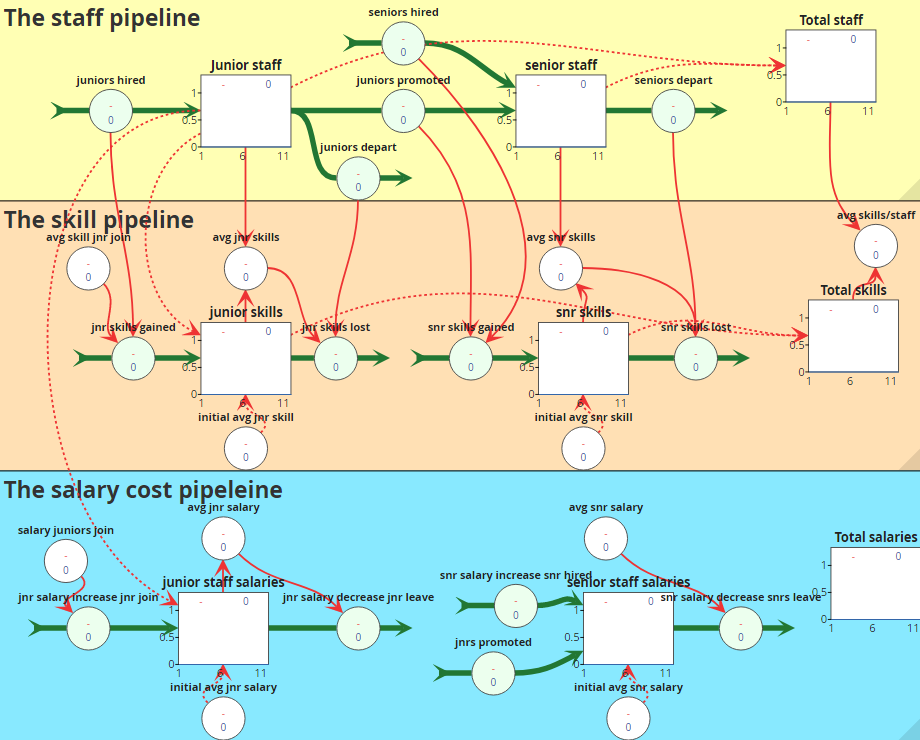
Fig 10.2b can be extended to include several categories of staff as shown in Fig 10.2c. Each staff category will have its own stock of staff skills and different rates of inflow and outflow. The stocks of the different categories of staff and their associated skills can be individually summed to give total staff and total skill. An overall average of skills per staff member can then be calculated. Note that not all links are shown and red lies indicate that computational paths are not complete.
Fig 10.2c
10.3.3 Staff receive salaries that also travel with them
Salaries are also an attribute of staff. As staff move through the various classifications their salaries move with them. The structure for salaries is similar to that for staff and skills in Fig 10.2c, and shown in Fig 10.2d. Not all linkages have been shown to avoid cluttering the diagram.
Fig 10.2d
10.3.4 Skill levels affect work capacity and work done; Morale is important
Skill levels obviously affect the amount of work that is capable of being done, work capacity. The higher the skill level and competence the greater productivity is. Low skill levels are likely to affect the amount of work that is not done right the first time. This causes rework which is added to the work to be done (an inflow), together with the normal inflow of new tasks.
Morale in the workplace is important. Low morale can increase staff resignations, while high staff skills can increase self-confidence and morale.
Fig 10.2e illustrates the main structure for this. It follows the Demand, Supply, and Supply servicing Demand layout used in previous examples.
Fig 10.2e
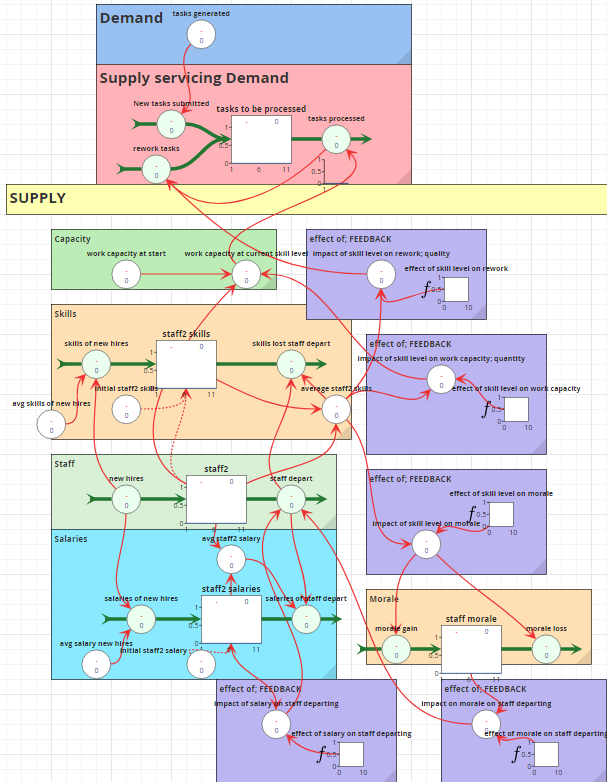
Comments on Fig 10.2e
- The overall layout from the top, of demand, supply servicing demand and supply, is similar to that of the SCS of the two previous examples of backlog reduction and quality improvement.
- Fig 10.2e is not a full computational model; its purpose is to show the main structural elements of the model
Supply
- The staff, skills and salaries, part of supply, is structured similarly to Fig 10.b and d, but with only one classification of staff for simplicity.
- The remaining parts of supply are work capacity, morale and the five effects of feedback loops
- Capacity: This small part calculates the quantum of work (tasks) that the Land Office is capable of performing.[ = N staff x days worked/mth x individual productivity x effect of average skill level].Not all variables are shown.
- Morale: This is an intangible asset and is included to illustrate its use. The initial value of morale could be set at the fraction that the current skill level is of the target.
- Effects of, feedback:–the level of staff skills affects separately, capacity, rework and morale; morale affects staff that leave; salary also affects staff that leaves. Feedback loops were illustrated and discussed in Chapter 4.
Demand only contains a variable tasks generated by customers (which is sufficient for this example).
Supply servicing demand
- This section is similar to that of the previous examples (Chapters 5 and 9) in that there is a stock of tasks that need to be processed, and an inflow of new tasks and an outflow of tasks processed.
- Demand and supply are linked in this section of supply servicing demand. Tasks generated (from demand) is equal to new tasks submitted, and work capacity at current skill level (from supply) is equal to task processed
- In previous examples variables such as backlog, waiting time, work pressure and feedback loops were shown. These are not shown here as this is not the prime purpose of this example and model
Staff development and increasing skills are fundamentally about increasing work capacity on the supply side. The variable, average staff skill, will have an effect on both work capacity and the % of tasks done right the first time.
10.4 The SCS of the System where Performance is to be improved
The purpose of a SCS (Schematic of the Core Structure) is to quickly /understand /communicate/ portray the essential structure of the system being examined and to gain insights into the dynamics of the system, all without waiting for a skilled person to build an operational SD model.
The storyline for this example in Sec 10.1 provided the setting and an idea of the system. The system where performance is to be improved was outlined in Sec 10.2 1. The previous section 10.3 showed some of the SD structural building blocks for staff development.
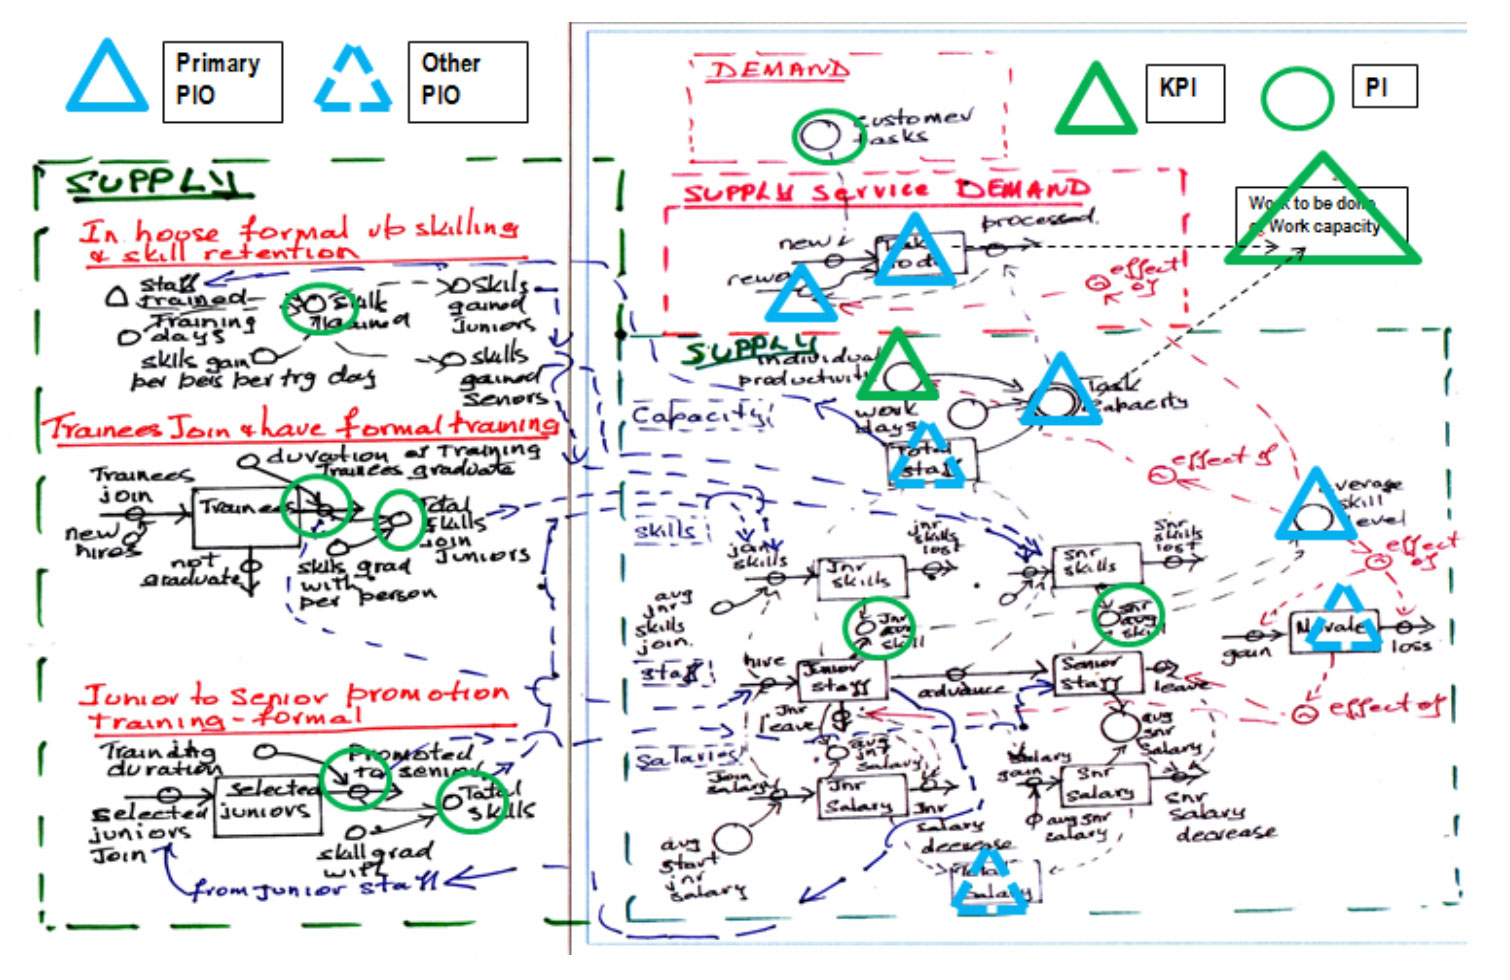
10.4.1 The SCS (Schematic of the Core Structure) – a First Pass
Fig 10.3 provides a 1st pass of a hand sketch of the SCS.
Fig 10.3
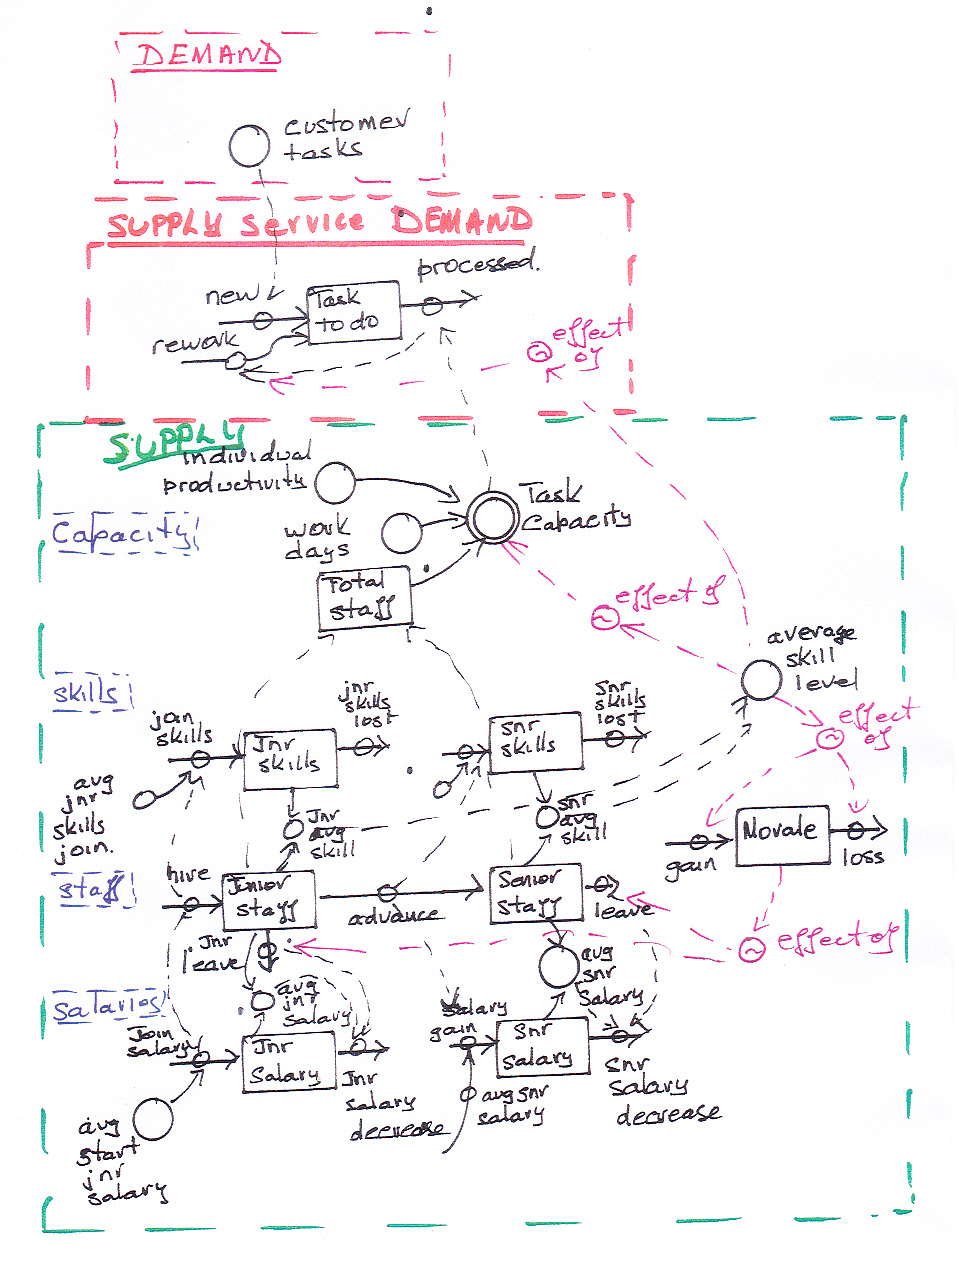
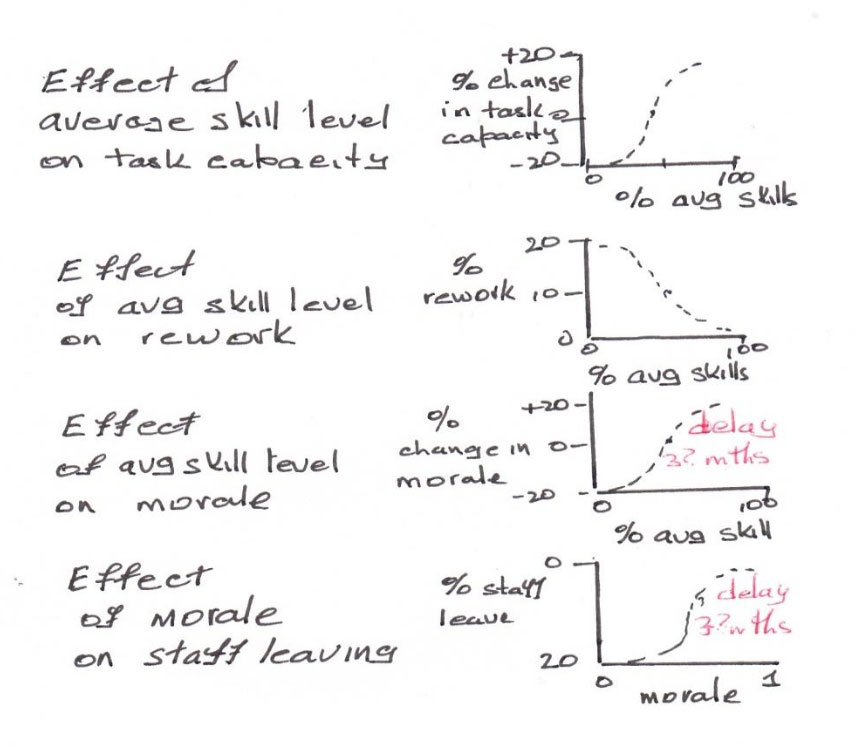
Sketches of indicative effects of graphical functions are shown in Annex B.
10.4.2 What the SCS is indicating,qualitatively,about the dynamics in play with no IDA
From the structure of the SCS (Fig 10.3) and the values and trajectories of the POTs (Fig 10.1) it is possible to draw some preliminary observations about the current dynamics of the system:-
- The current low “average staff skills” is just over half of the desired level and is due to:-
- There being no formal training of staff before they join those working, or for those who are already working in post. Skills are mostly acquired randomly by observation on the job
- There is no way for people who have skills to be recruited
- This low “average staff skills” value causes:-
- Low individual productivity and low group work capacity
- A higher than desired amount of rework
- A potential build up in tasks to be done (i.e. backlog increases) as demand nears supply
- Morale is low, which in turn affects productivity and the % of staff who leave. This in turn leads to a decrease in average staff skills (the leavers take their skills with them), and the appointment of replacement junior staff with no/few skills (a downward spiral)
The above comments, the SCS of Fig 10.3, and the POT graphs of Fig 10.1 allows discussion to occur about what could be PIPs (performance improvement proposals) that might achieve the desired future performance trajectories of the PIOs, the blue lines in Fig 10.1.
10.4.3 The PIPs (Performance Improvement Proposals) and indicative inputs
The PIPs
A brainstorming session was held with senior staff and the following PIPs were identified:-
- Have a separate staff category of trainees. Recruit selected people into this category, and train them for a specific period of time so that they have a certain level of required skills before they join as juniors
- Institute a formal regular in-house training program to provide “brushing up” of skills that seem to be causing rework, or impart required new skills
- Increase the rate at which junior staff advance to become seniors
- Hire, as senior staff, some people who already have a number of relevant skills
- Run formal junior to senior staff promotional training
- Modify the roles of senior staff so that they have a time allowance to support/coach junior staff
- Improve procedures, workflows, technology2
- Some combination of the above
As in the two previous examples each of the above PIP will be tested for effectiveness and sustainability (Sec 10.5.3 refers).
A first pass at indicative inputs
Table 10.1 shows a 1st pass at inputs, indicative and order of magnitude only.
Table 10.1
| No. | PIP | Length of Training | Number Involved | Effect Anticipated | Remarks |
|---|---|---|---|---|---|
| 1 | Have trainees and formal training. | 2 months | 12 per year | Trainees will graduate with 3 of 5 target skills for juniors. The average current skill level of juniors is 3. | Two senior staff will have to conduct training, and there will be a loss in total task capability. |
| 2 | Formal regular in-house skilling. | 1 day per month | 10 per month | Those attending will gain 0.2 skill per session attended. | As above. |
| 3 | Increase the rate at which junior staff advance. | — | 5% of junior staff currently advance per year. | Minor, as staff who advance have low skill levels. | — |
| 4 | Hire skilled senior staff. | — | 1 person each 6 months apart, once only. | Increase the number of senior staff with higher skill levels. | May be difficult to find new hires with the necessary skill level to be a senior. This will also increase the salary bill. |
| 5 | Run formal promotional training for junior to senior advancement. | 1 month annually | 4 juniors per course | Junior staff, on advancement to senior, will have 8 out of 10 skills, an increase of approximately 4 skills compared with current levels. | Senior staff will have to conduct training, and there will be a loss in total task capability from both senior and junior staff involved. |
| 6 | Senior staff to mentor juniors. | 1 hour per day, reducing as junior skills increase | Throughout the year | The skill level of junior staff will gradually increase. | Senior staff will lose some of their own processing time. |
| 7 | Improve procedures and workflows. | — | — | 20% improvement in productivity and work capacity. | Not strictly part of staff development, but included to see the effect on PIOs. This would require IDA. |
| 8 | Some combination of PIPs 1 to 6. | — | — | Some improvement on individual effects. | — |
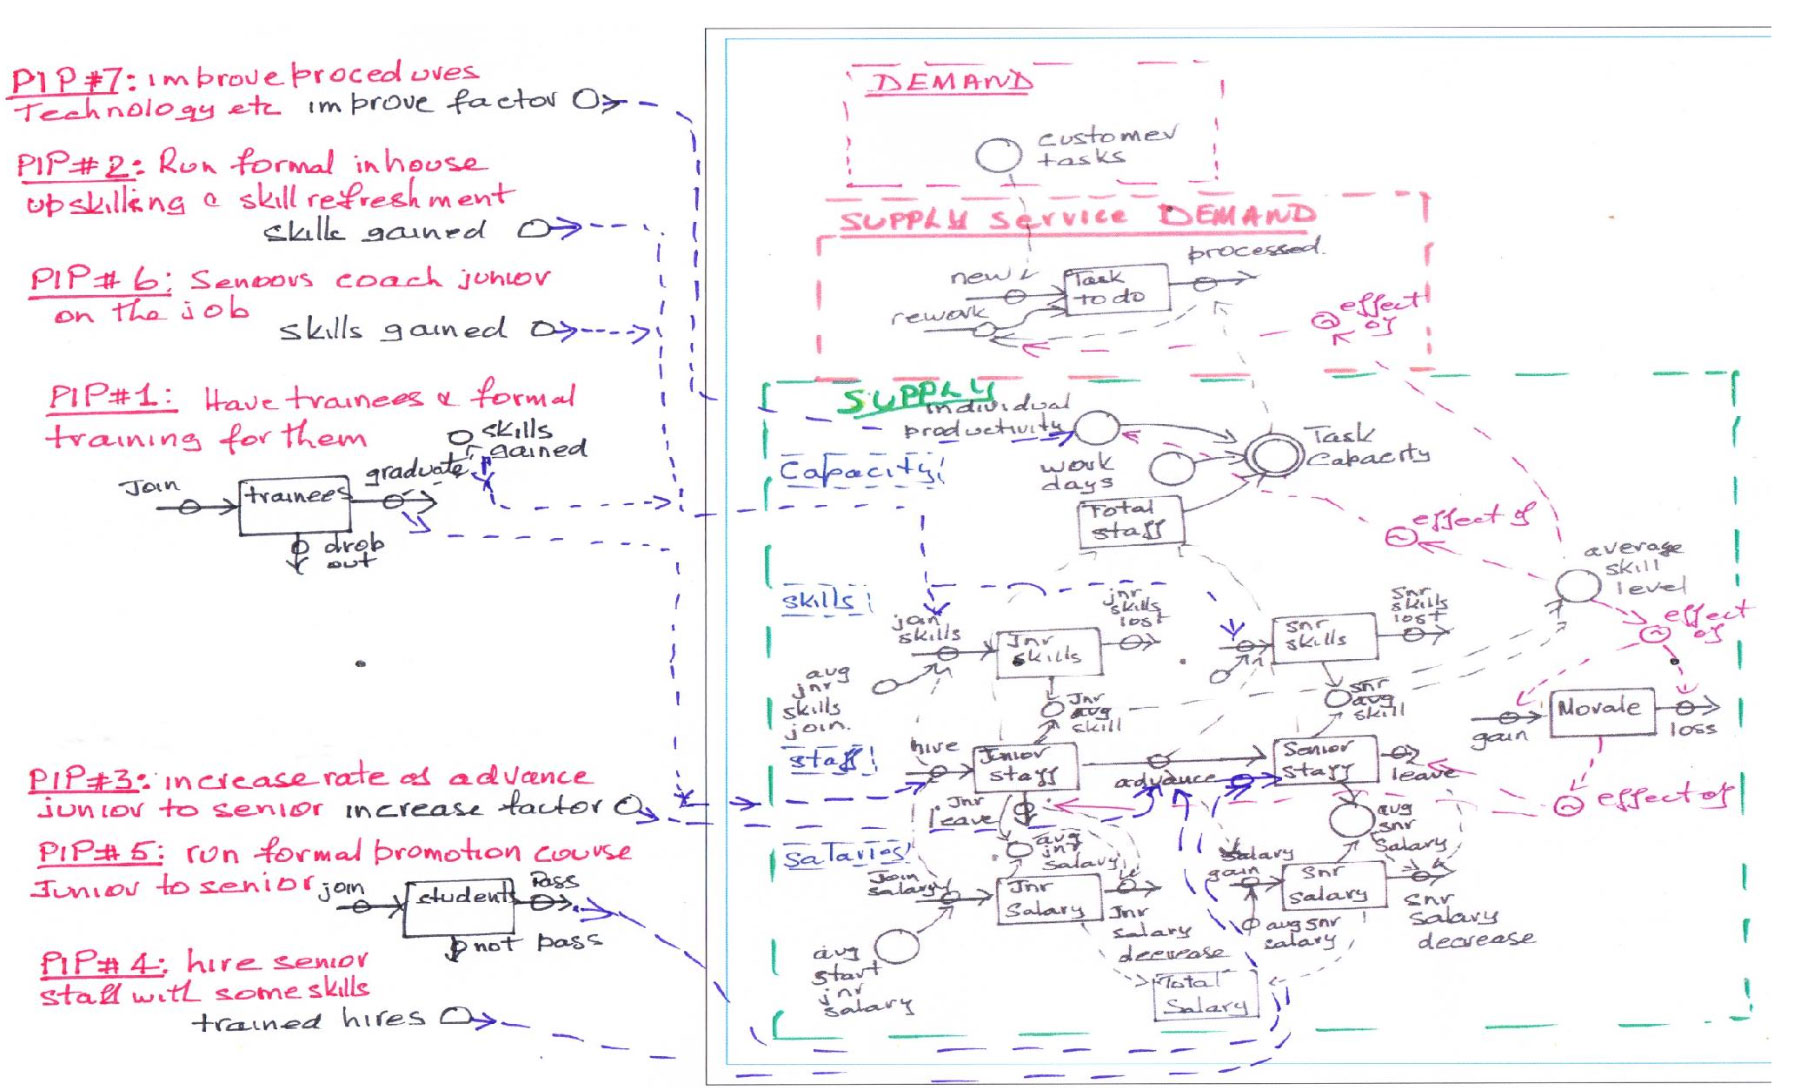
Fig 10.4 shows the PIPs superimposed on the SCS of Fig 10.3. Indicative mechanics for each PIP are outlined and blue lines drawn to indicate the part of the model each PIP affects.
These PIPs can be tested for effectiveness and sustainability, separately or in any combination using the SD model (Sec 10.5 refers), and as illustrated for the two previous examples in Chapters 5 and 9.
Increasing staff skills takes effort and resources
Increasing average staff skills is very important as this will increase processing capacity and reduce the amount of rework. However, increasing staff skills will require some form of “upskilling” or training activity (possibilities are the various PIPs).
Whatever the method of upskilling or initial training, some experienced staff will be required to prepare training material and conduct the upskilling. This will require a secondment from their normal task processing work and this will reduce the overall work capacity to do the work to be done for the periods of secondment. This is taken into account in the model when testing the relevant PIPs.
Fig 10.4
10.5 Building and using the SD model to test the PIPs
10.5.1 Building the SD model
An SD model was developed based on the SCS of Fig 10.4. This model has a reasonable amount of detail and does not fit on a page so no image is shown. The model combines the structure forms of Figs 10.2d, 3, and 10.4, with the additional necessary detail for a computational model. Contact the author at [email protected] if interested in more detail. As noted previously the aim of this booklet is to show what the SD approach is, how it can be applied and the results obtained, but not to go into the mechanics of model building.
10.5.2– Showing that the SD model can replicate past POT
In the storyline of this example it was very difficult to determine any past POT data for the Lands Office as all personnel data was bundled for all types of provincial staff. It was determined that:-
- The effort of trying to extract past POT data for the Lands Office by itself and by time would not be worthwhile as the results would not be very reliable, and that the sketched indicative past POT data in Fig 10.1 would suffice
- POT data for M&E would be collected (assuming a program for increasing skills, and achieving the other PIOs was undertaken).
Running the SD simulation model, without any PIPs active, provides the Base Case which is the provincial Lands Office Continuing AS IS. The results of the Base case are shown in row 1 of Fig 10.5a. It can be seen that the trajectories generated for the base case are similar to those sketched of past POT in Fig 10.1 and continue that past trajectory. This gives some confidence in the model.
10.5.3 Testing each PIP for effectiveness and sustainability
10.5.3.1 The test for effectiveness and sustainability
The test for effectiveness and sustainability of a PIP is:- how well each of the future trajectories generated by the SD model for each PIO, aligns with their desired future trajectory as shown in Fig 10.1.
The previous two examples (Chapters 5 and 9) showed that the most suitable PIP was likely to be some combination of the list of PIP initially brainstormed (Table 10.1) and that some fine tuning from running What Ifs would probably be necessary to determine the improvement strategy. This becomes more likely when trying to achieve multiple PIOs as in this example (Sec 10.1).
For the above reason, testing was carried out in two stages:-
Table 10.2a
| Stage | What Aiming to Achieve | How It Will Be Achieved |
|---|---|---|
| 1 |
|
By examining the effect that each PIP has on selected PIOs and PIs. |
| 2 | Fine-tune the selected PIPs to:
|
By fine-tuning parameters to achieve optimum future trajectories of the multiple PIOs. |
10.5.3.2 Stage 1 of testing the PIPs
The following PIOs were used in Stage 1 testing.
Table 10.2b
| No. | Performance Improvement Objective (PIO) | Reasoning | What Is Shown in POT Graph of Fig. 10.5a |
|---|---|---|---|
| 1 | Increase average skill level. | If skill levels rise or fall, so should work capacity, the percentage of work done right the first time, and morale. | Average skill level for junior and senior staff. |
| 4 | Demand compared with supply; for example, work tasks submitted compared with capacity to undertake the work. | To get an idea of when supply is likely to become less than demand, causing backlogs and higher rework. | Tasks submitted and work capacity. |
| 3 | Keep backlog low. | If skill levels rise or fall, so should work capacity. The percentage of work done right the first time should increase, while rework and backlog should fall. | Backlog. |
| 7 | Keep total staff numbers about the same. | If total staff numbers are kept about the same, then total salaries should remain about the same. | Staff numbers: total, senior and junior. |
| 6 | Reduce staff turnover. | If skill levels rise or fall, morale is also likely to change, and this affects staff turnover. | Percentage of junior and senior staff leaving. |
Fig 10.5a shows in order:- the desired future POTs for the PIOs; the base case (no aid, continue as is); the results of Stage 1 testing of PIP#1 -7 separately.
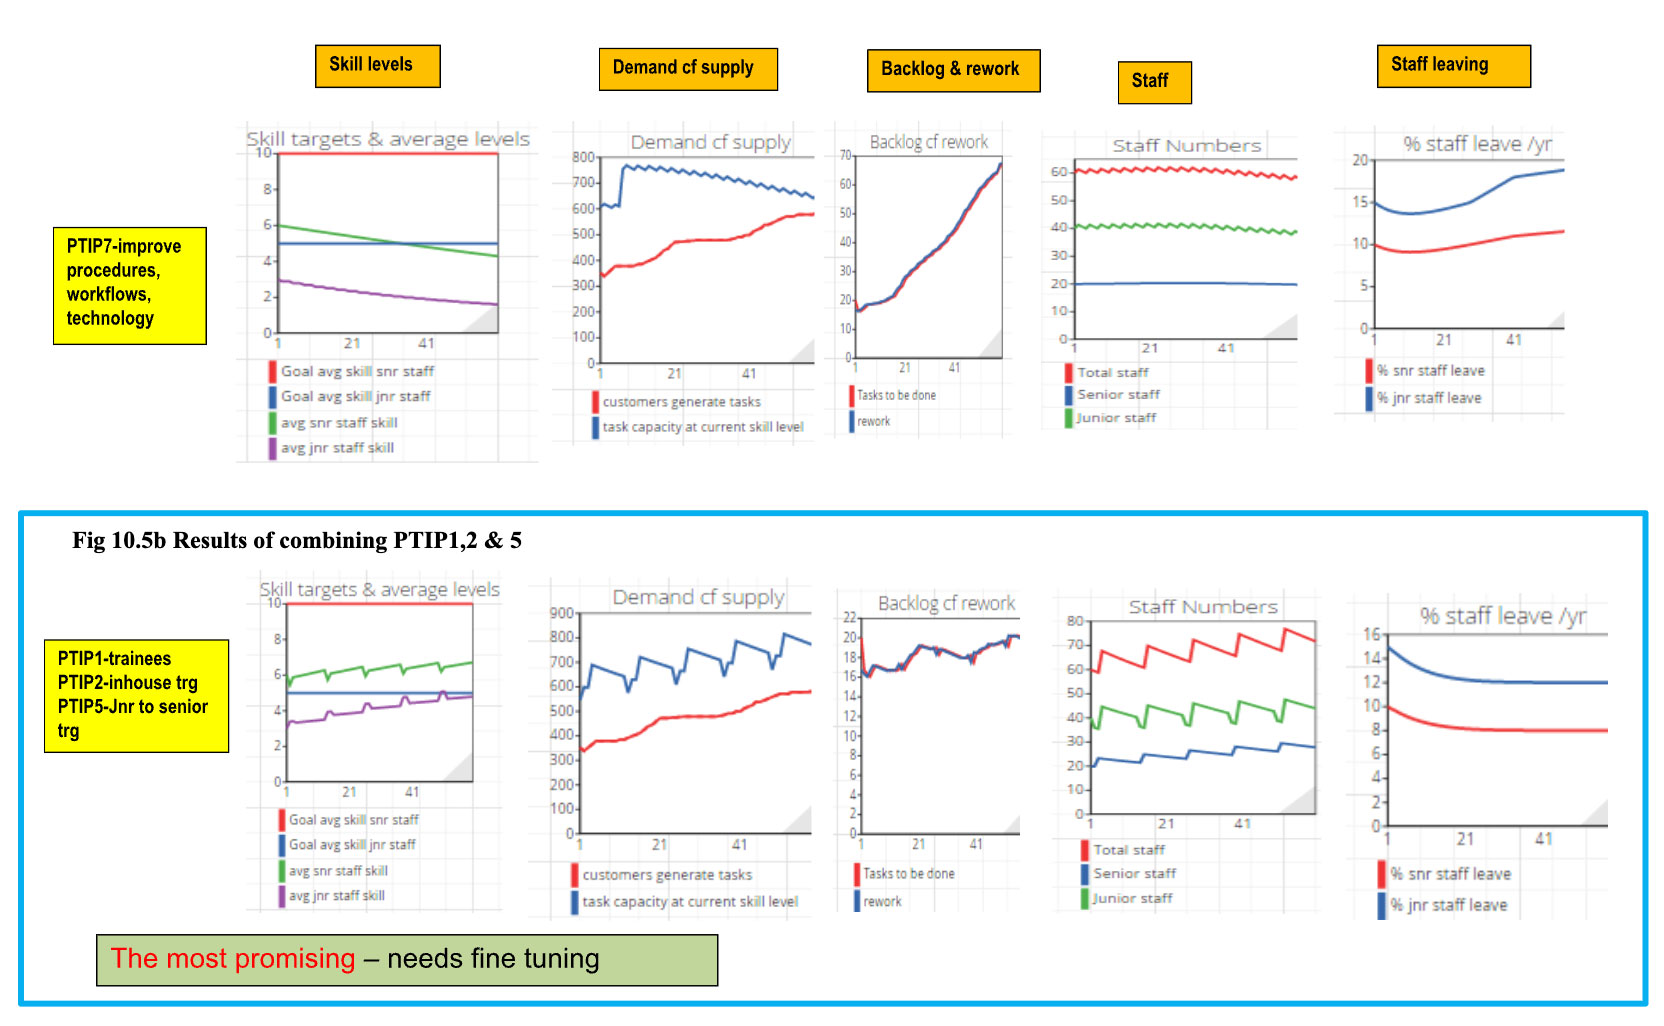
Fig 10.5b shows the results from testing the combination of PIP#1,2, 5.
Comments on the results of each test are in Table 10.3.
Fig 10.5a Results of Stage 1 testing the PIPs for effectiveness and sustainability
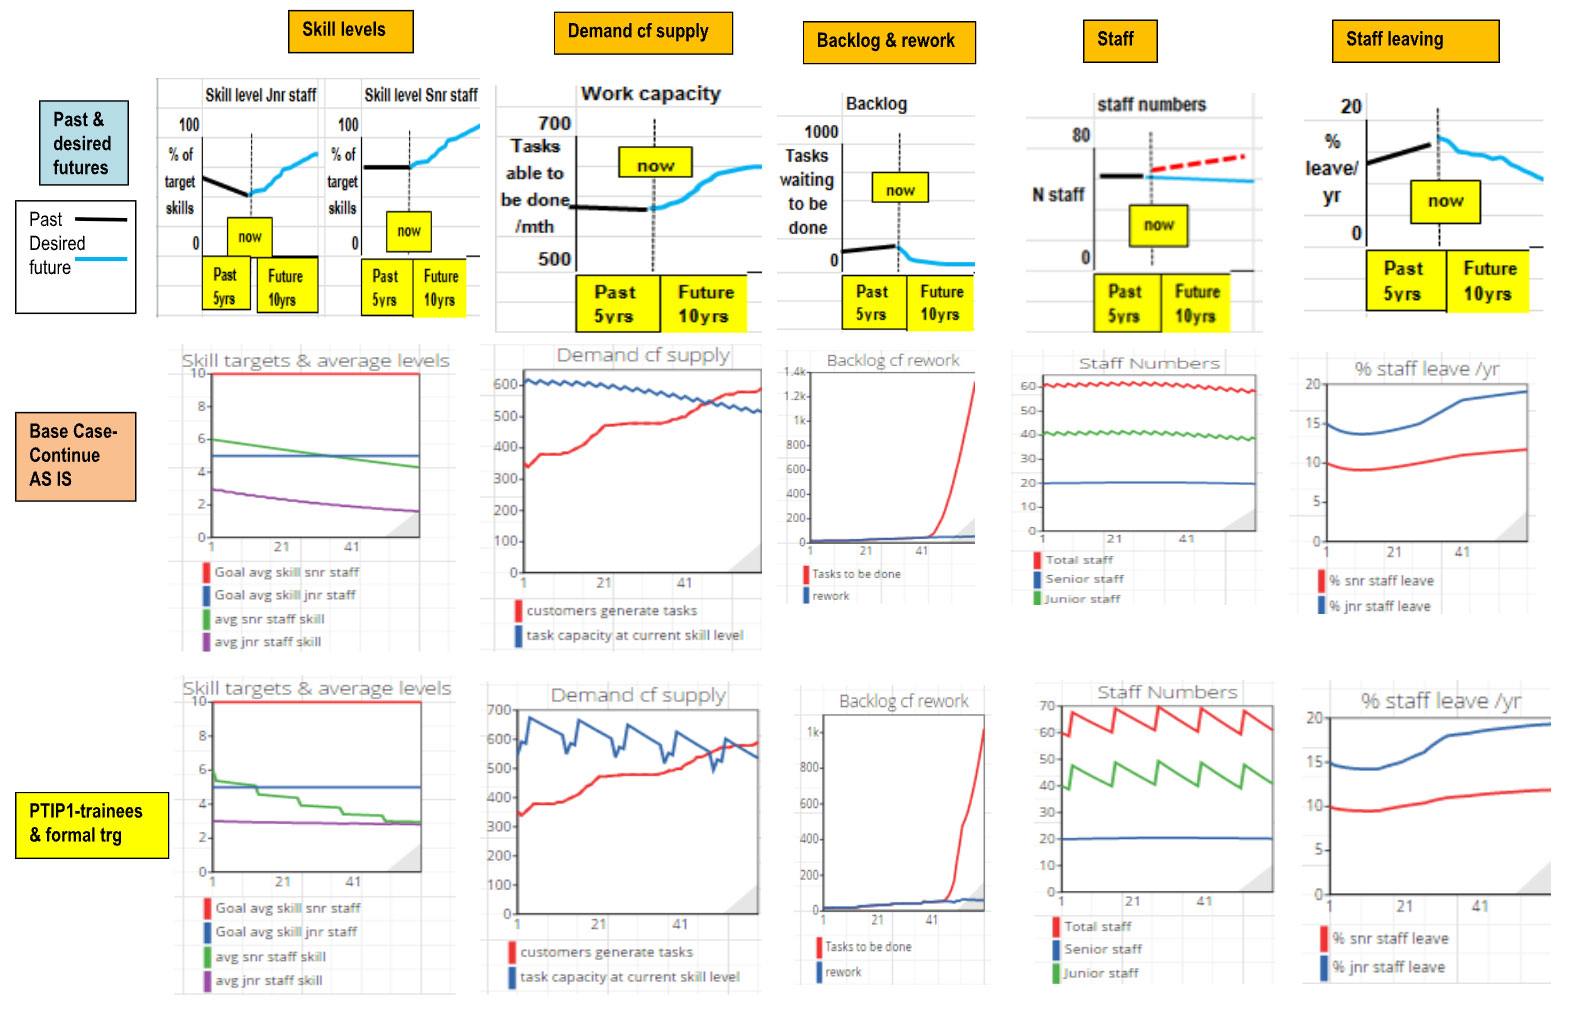
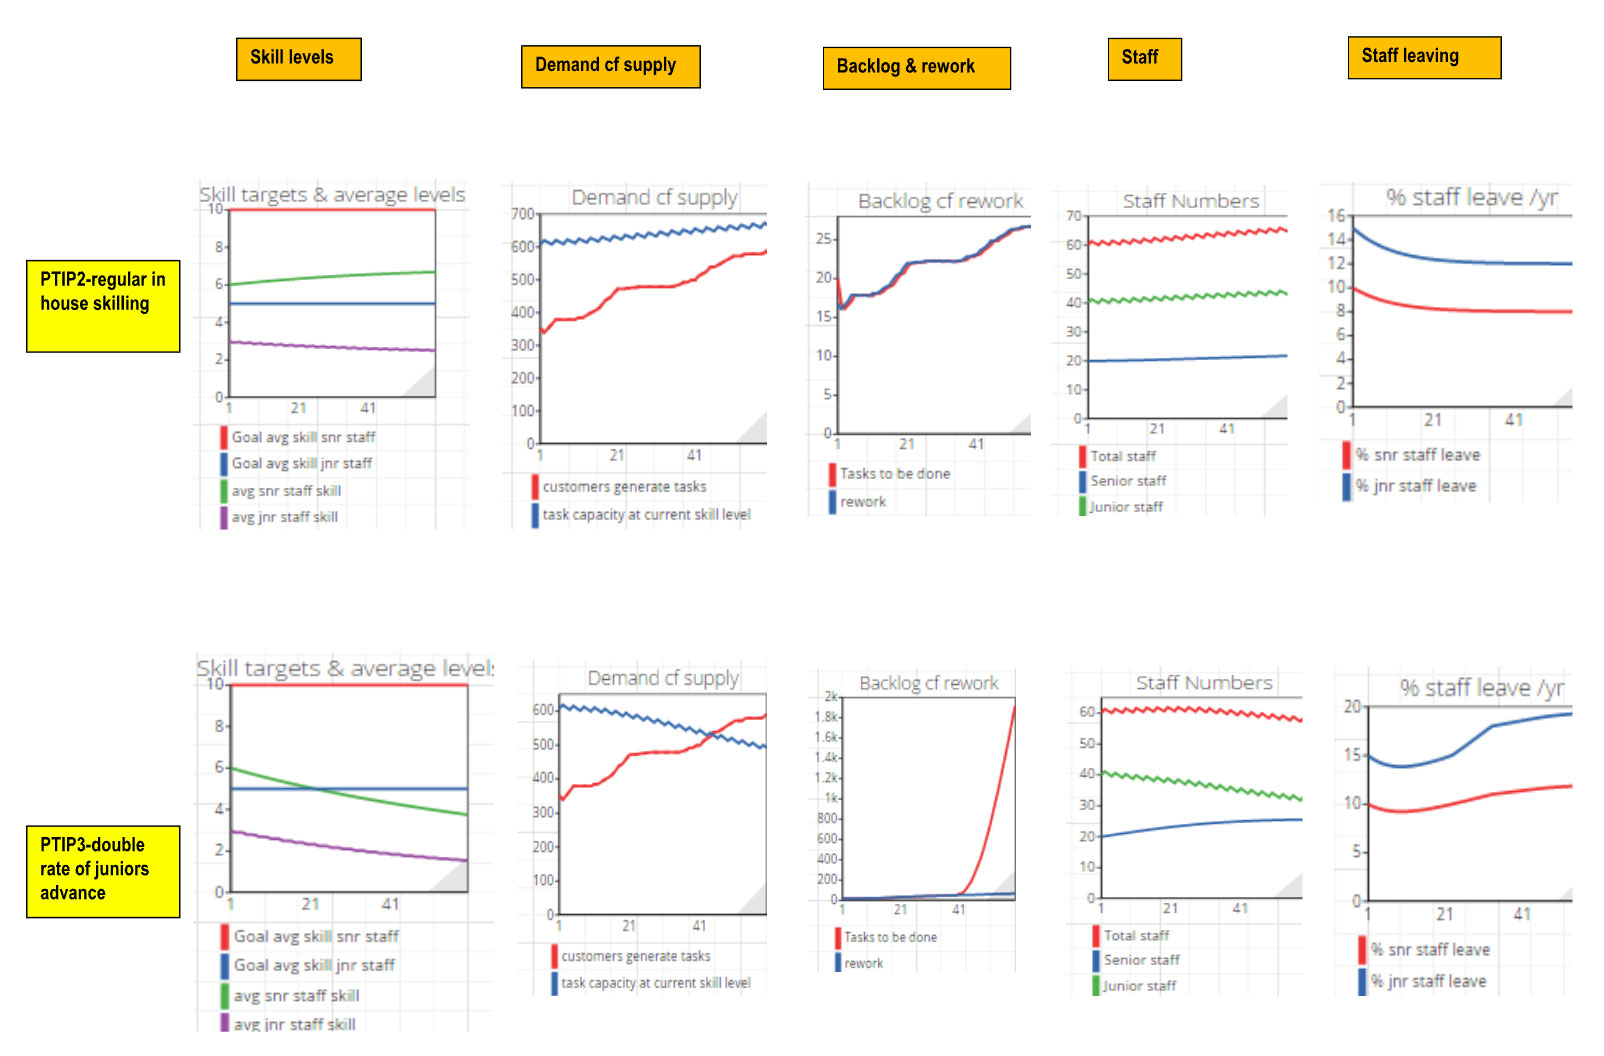
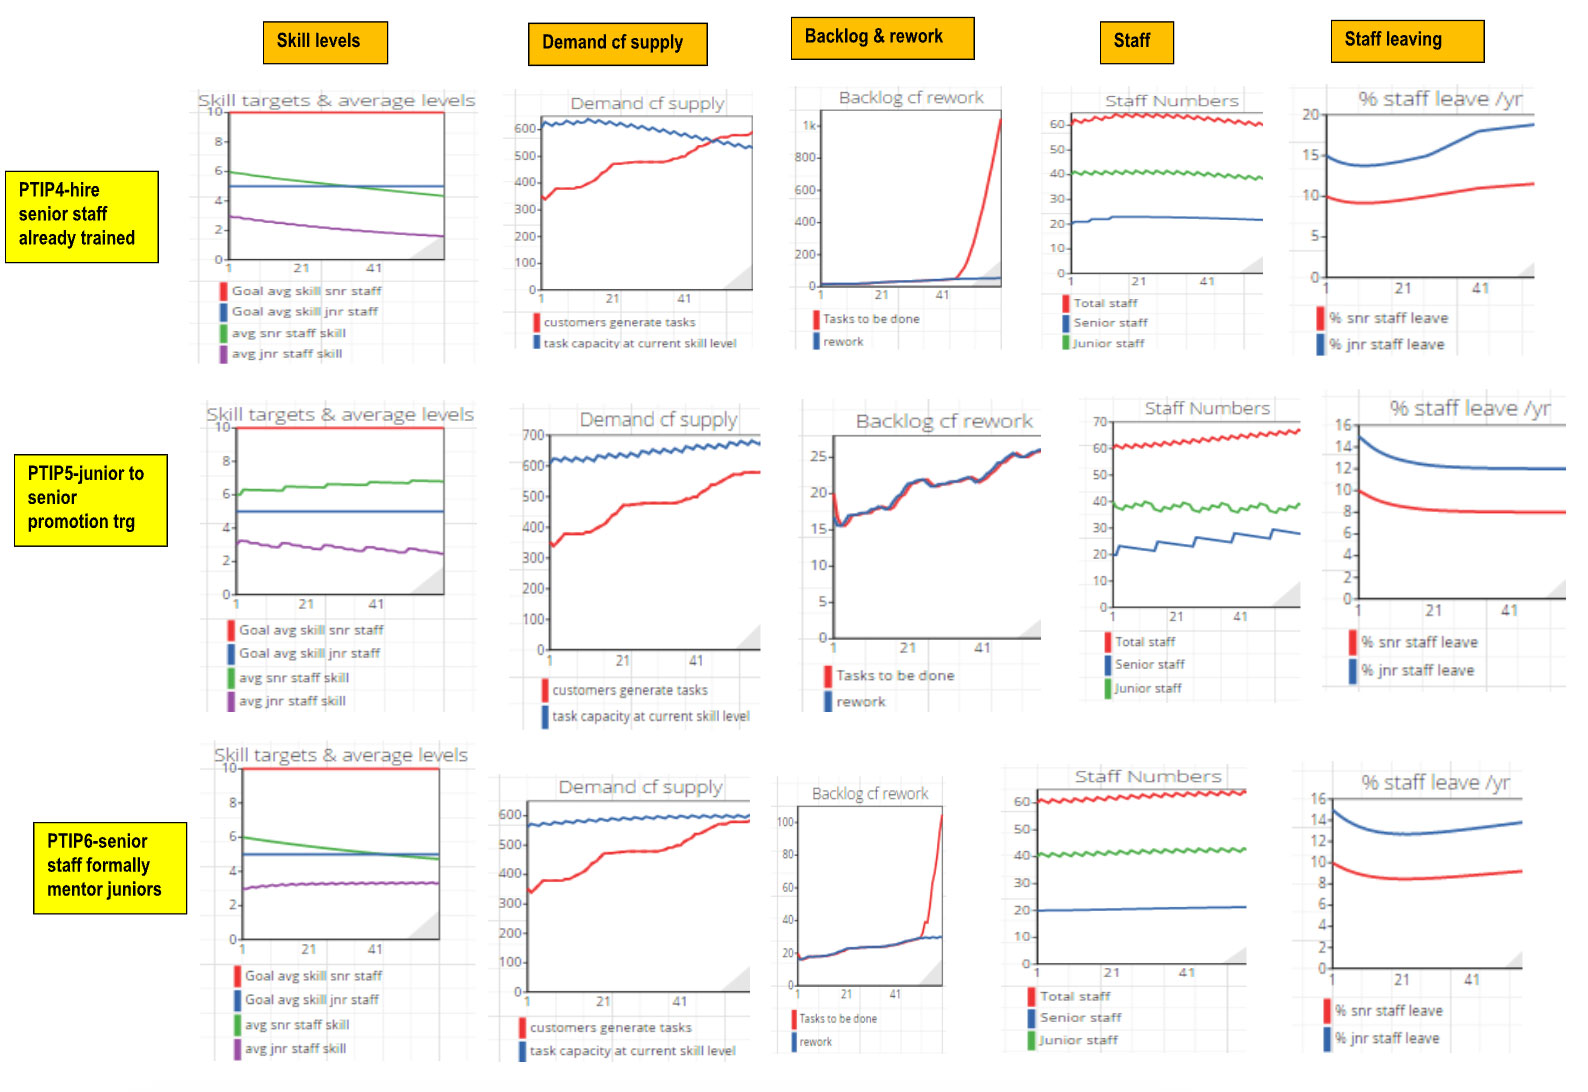
Results of Stage 1 - testing each PIPs for effectiveness and sustainability
Fig 10.5a shows the test results. Some comments on each follow in Table 10.3.
Table 10.3
| No. | PTIP | Comment | Conclusion |
|---|---|---|---|
| — | Base case — continue as is | Skill levels slowly decline. At approximately month 46, demand becomes greater than supply and the backlog will start to increase. The trend of trajectories is a continuation of past declining performance and moves towards the feared future. |
|
| 1 | Have trainees and formally train. | Skill levels of juniors are maintained, while skill levels of seniors decline. Secondment of some seniors to train trainees reduces work capacity. At approximately month 48, demand becomes greater than supply and the backlog will start to increase. Overall staff levels stay the same. |
|
| 2 | Conduct regular short in-house upskilling. | Skill levels of seniors slowly rise, while skill levels of juniors slowly fall. Demand remains less than supply at month 60, the length of the simulation, and the backlog is small, approximately 20, only due to rework. |
|
| 3 | Double the rate at which juniors advance. | Little effect; this is much the same as the base case. The main effect is to increase the number of seniors and reduce the number of juniors. | Discard this PIP. |
| 4 | Hire some senior staff with some skills. | Limited effect, as only two seniors are hired with average skills. Total staff numbers and salaries will rise for little gain. | Discard this PIP. |
| 5 | Conduct formal training for juniors before advancing to seniors. | Skills of seniors increase, but junior skills fall. Demand remains less than supply at month 60, the length of the simulation, and the backlog is small, approximately 20, only due to rework. Staff numbers slowly increase as the number of seniors increases. | Look at combining with other PIPs. |
| 6 | Senior staff formally mentor juniors. | Junior staff skills stay stable, but senior staff skills decrease because there is no similar programme for them. At approximately month 65, demand becomes greater than supply and the backlog will start to increase. | Could probably obtain the same effect through more effective in-house training, without senior staff being distracted. |
| 7 | Improve procedures and workflows. | Average skill levels decay because there is no programme to maintain skills, let alone increase them. At approximately month 70, demand becomes greater than supply and the backlog will start to increase. |
|
| 8 | Some combination of the above; selected combination is PIPs 1, 2 and 5. | Skill levels of both juniors and seniors increase. Juniors reach the target of 5 skills, but seniors only reach 7 out of 10 skills. Demand remains less than supply at month 60, the length of the simulation, and the backlog is small, approximately 20, only due to rework. Staff numbers slowly increase as the numbers of both seniors and juniors increase, as the percentage of staff leaving decreases due to morale increasing. | To be fine-tuned. |
Overall conclusion
The combination of PIPs 1, 2 & 5 should befine tuned. Attention needs to be paid to ways of increasing the skill levels of seniors to the target of 10. NB: When senior staff are seconded to train trainees (PIP1) and to train juniors trying for promotion (PIP5) a loss to work capacity occurs because some seniors are seconded to training and some juniors are in training.
10.5.3.3 Stage 2 -Fine tuning PIPs 1, 2, 5 and testing for effectiveness and sustainability
The nub of the upskilling challenge is that current juniors and seniors have just over half the required skills, and that some seniors will be required to conduct the inhouse upskilling, train the new trainees, and conduct the promotional training from junior to senior.
The fine tuning to be examined is along the following lines:-
- Initially focus in house upskilling on raising skill level of the seniors by increasing the number of seniors being trained per training day and also increasing the number of training days per month. [the aim being to get senior staff close to their skills target, and thus work capacity is increased before seconding some seniors to train trainees and juniors for promotion]. Once senior skills have risen, inhouse training for juniors can commence as well as the normal maintenance of skills at a less intensive rate. (fine tuning PIP2).
- Commence training the trainees when senior skill levels raise to ~¾ of required senior levels, and aim to graduate trainees with 80% of required skills (rather than 60% as in stage 1); as % of juniors leaving falls, reduce the intake of trainees (fine tuning PIP1)
- Continue with the formal training for the advancement of juniors to seniors (PIP5), but reduce the number undergoing this annual training from 4 to 3 [to keep senior numbers from increasing too much, and total salary costs from rising too much]
NB
- While the productivity of both junior and senior staff is on average 1 task completed every 2 days, workflow is such that junior staff process relatively straight forward tasks, while senior staff process more complex ones.
- The aim of fine tuning is to lift the skills, and hence productivity of all staff so that, when senior staff are seconded to train trainees and juniors on promotion, there is less of a work capacity loss.
- Fine tuning can be considered as What Ifs. Additional What Ifs could be variations in demand (increases or falls)
Results of Stage 2 testing (the fine tuning)
Fig 10.6 shows the results of fine tuning. The desired futures for these are shown in Fig 10.1.
Fig 10.6
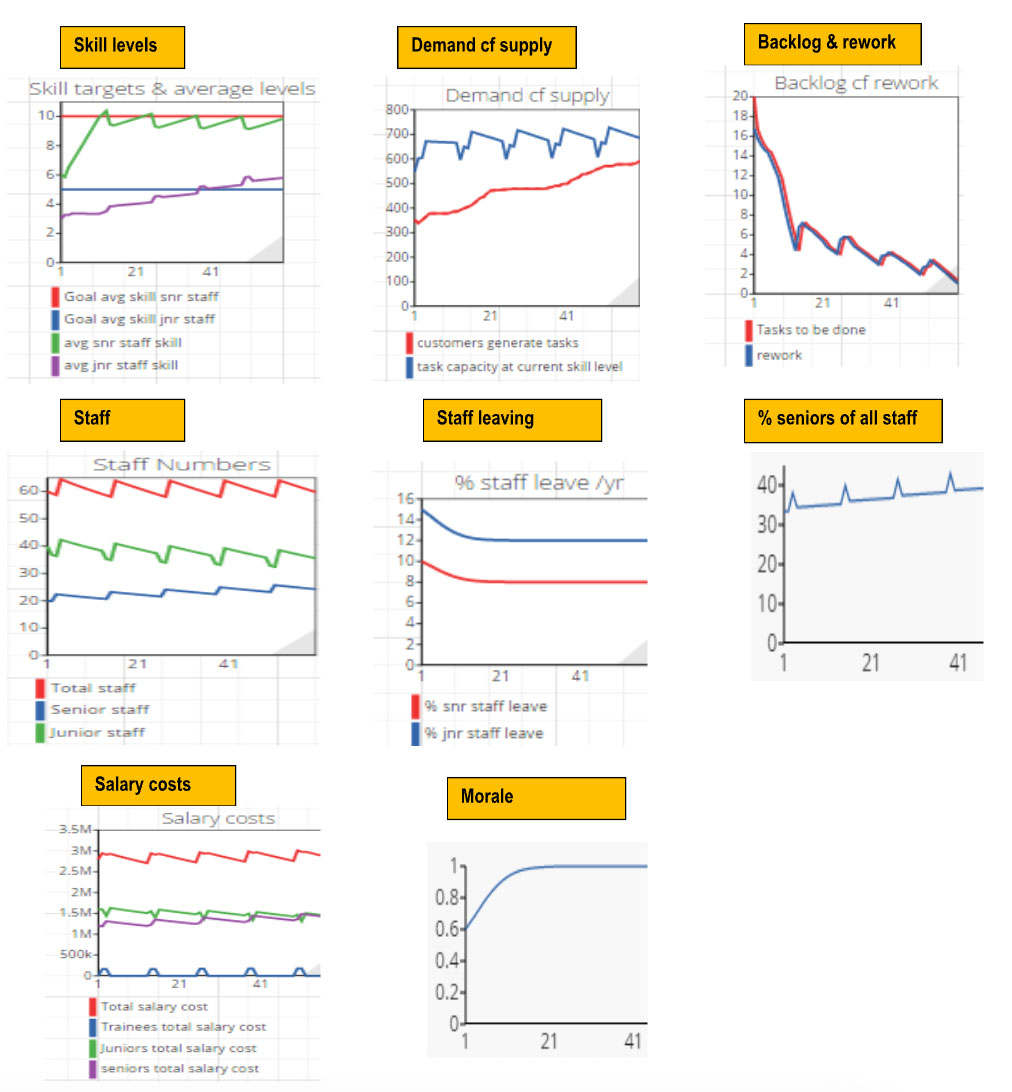
Comments on Fig 10.6 above
- All trajectories, compared with Fig 10.5b, have improved, showing that fine tuning improved the combination of PIP#1, 2 & 5.
- All PIOs have been achieved:-
- Both seniors and juniors have reached their target skill level. Morale has increased as skill levels increased
- Rework and backlog are minimal
- Work capacity has increased but regularly decreases temporarily when senior staff are seconded to train others
- Staff numbers are essentially stable and the same as before staff development. commenced. The % of seniors has increased a little. Staff departures have declined
- Salary costs have essentially remained stable.
- A better system of staff development has been modelled as all PIOs have been achieved.
Conclusion
The improvement strategy should be based be based on the fine tuned combination of PIP#1, 2 & 5.
10.5.4 Overall comments on the model
The SD model is only a model which has been used to test improvement proposals for effectiveness and sustainability. It is good practise to remember the adage "all models are wrong but some are useful".
In Sec 10.5.2 comment was made on the lack of "hard" historical data for staff in the lands office of this example, and having to rely on the sketched past POT trajectories to get an indication if the base case of the model could replicate past POT.
This model is considered useful in that it develops a view of what the current skill levels are and how they change over time and why, logically, transparently and quantitatively. It allows the testing of proposals to improve, showing the what, how, why and when, leading to the identification of an improvement strategy.
Further refining of the model is possible but is not considered useful because of the limitations of past data and the model itself. There comes a time to learn by doing, drawing upon the insights obtained from the model. Doing more with the model would invoke the law of diminishing returns. Much will be learnt by recording, tracking the PI (performance indicators) and using the results during M&E (monitoring and evaluation), and using the model and the PI values as a LBM (living business model). Sec 10.8 refers.
10.6 Improvement Strategy, Risk Identification and Mitigation
The improvement strategy as well as being based on the results from testing the PIPs needs to take into account risks and incorporate risk mitigation.
10.6.1 The improvement strategy from testing the PIPs
The improvement strategy should be based be based on the fine tuned combination of PIP#1, 2 & 5.
10.6.2 Risk Identification, What Ifs, Risk Mitigation
Risk Identification
Two major risks have been identified. The first relates to the immediate training program, the subject of this example. The second is a mid term issue identified while fine tuning the combination of PIP#1, 2 & 5. The risks are:-
- That the formal training does not result in the hoped for increase in skills for any/all of the following reasons: duration of training is insufficient; training material/methods need improving
- The model indicates (via the Demand cf Supply POT graph) that at about month 60 demand will be getting close to supply, and that potentially 1 year later supply will no longer be able to meet demand
The qualitative effect of Risk #1 is that skill targets and work capacity would not be reached with a flow on effect on backlog, and the ability of supply to meet demand. The magnitude of the effect would depend on how much skill increases fell short.
The qualitative effect of Risk #2 is that potentially in ~ month 72 supply will no longer be able to meet demand and the backlog will start to grow, waiting times increase, rework increase etc. Management might be tempted to reduce training to increase work capacity, which could lead to reduced skill level, reduced work capacity, increase rework and backlog – a downward spiral from the improvements in training achieved. Therefore it could be prudent for management to examine, while there is adequate time, the following:-
- Potential ways to increase individual productivity and work capacity (without increasing staff numbers); e.g. procedures, workflows, changes to legislation. This was illustrated in the first backlog example (Chapter 5 refers), and was PIP#7 in this example which was considered out of scope for the immediate training problem of this example
- The task split of juniors and seniors, target skill level, their numbers etc to see if refinements can be made (unlikely to have a major long term impact)
- The potential to upskill regular customer groups on Land Office procedures/requirements to raise the standard of tasks submitted, so staff can spend less time “advising” customers on procedures and requirements, and spend more on processing tasks (unlikely to have a major long term impact, but would assist)
- If it looks as if staff numbers need to be increased, management might like to examine if the example shown in Chapter 9, where quality and reputation were significantly increased, customers won back, and staff increases funded from a small % of the increased revenue achieved.
Quantitative What Ifs for risk impact using the SD model
For Risk #1 a number of What Ifs could be run, using different course duration and rates at which skills are gained. While this would provide additional numeric data, it may not provide much useful additional information to that learnt from Figs 10.5a, b. As noted in the story line, there is no past data relating to training in the Lands Office.
For Risk #2 extend the simulation time period for another 5 years or so and do the following:-
- Run PIP#7 together with the fine tuned combination of PIP1,2,5 and extend the model to include financials
- Combine the model for this example with the model for the example in Chapter 9 (increasing quality and reputation, winning back customers and using a small % of increased revenue to achieve adequate O&M annual budgets), and examine closely
- Include a PIP for upskilling regular customers re Land Office procedures and submitting applications
The above are indicative, not exclusive. There is no immediate urgency in addressing Risk #2 but it needs to be done.
Risk mitigation actions
For Risk #1 there are two main actions which need to be undertaken when approval is given to implement the training program:-
- Engage a training specialist to assist the designated in house trainers from the senior staff design the details of the training courses, prepare the training material, and to deliver the training, until the in house staff are confident
- Use the SD model as a LBM (living business model) for M&E and management action
For Risk #2 engage the local staff development specialist with SD skills to modify the model, carry out the additional testing identified, and work with provincial management on drawing conclusions and action plans.
These mitigations are incorporated into the improvement strategy in Sec 10.6.3.
10.6.3 The improvement strategy including risk mitigation
The improvement strategy is shown in Table 10.4. It draws upon the results from fine tuning the combination of PIP1, 2, 5, and the risk mitigation actions.
Table 10.4
| In General | In Particular |
|---|---|
| For the New Training Programme | |
| Institute a group of trainees and formally train them to become juniors. |
|
| Conduct formal and regular in-house upskilling for juniors and seniors. |
|
| Conduct formal annual training for the promotion of juniors to seniors. |
|
| Risk mitigation for the training. |
|
| For the Mid-Term Challenge of Increasing Supply Work Capacity | |
| Risk mitigation for the mid-term challenge of increasing supply work capacity. |
|
10.7 Financials, Evaluation, Decision to implement the improvement strategy or not
The story line of this example
The storyline of this example (Sec 10.1) was that a skills development specialist who had SD experience was called in by senior provincial officials to advise on a strategy to improve the low skills, high rework and high staff turnover in the provincial lands office.
What was done
The skills development specialists with provincial management determined the PIOs (Sec 10.1), and with lands office staff the POT graphs of past, future desired, and feared futures of the PIOs were sketched (Sec 10.1 Fig 10.1). Eight PIPs were identified with Land Office staff (Sec 10.4.3) and these were “tested” using the SD model with results and discussion in Sec 10.5.3. A recommended improvement strategy was discussed with Provincial and Land Office management.
Provincial senior management considerations and decision
Considerations
- That there was local specialist training expertise available and sufficient provincial budget to hire this specialist part time
- That the benefits of an improved training framework and program were obvious, as indicated by the PIOs; that the improvement strategy had a good chance of achieving the PIOs. Therefore a detailed financial and non financial evaluation was not required
- That this program in this single land office would be treated as a pilot, and if successful IDA might be sought to assist in a major roll out to many other land officers
Decisions
- To implement the improvement strategy using internal resources and budgets.
- To closely monitor progress using the SD model as a LBM, and to use the skills development specialist with SD experience to assist using internet technology
10.8 Using the SD model as Living Business Model (LBM) to assist M&E
As indicated in Sec 10.5.4 much is learnt by doing. Learning during implementation is enhanced by recording and comparing real word data for KPIs/PIs (key and performance indicators) against model generated targets, and using that data to assist implementation management to achieve the desired targets.
As real world data is correct any major variations will require modification to the model to gain greater agreement. Setting revised performance targets may also be necessary. These were illustrated in the previous example of improving quality where the model was used as a LBM (Chap 9 Sec 9.6 refers),
The KPIs and PIs to be used
In the two previous examples it was shown that the PIOs are KPIs, and that PIs and perhaps additional KPIs can be identified from the SCS. For the first backlog example this was shown in Sec 4.10.1and in Sec 7.2.1 and Fig 7.4 where the dependency trace feature3 in the Sysdea software was used to identify the causal chain to the PIO, backlog, and also what was dependent on the PIO. For the improving quality example this was shown in Sec 9.2.3. Even though the dependency trace is not currently available in the software, this identification can easily be done using the SCS of Fig 10.4 as will be shown. Fig 10.4 showed the SCS with the PIPs to be tested. As a result of testing, the improvement strategy was based on fine tuning PIPs 1,2,5 (Sec 10.6.3 refers).
The nub of the improvement strategy is raising the average skill levels of junior and senior staff to a target value, and then sustaining that target value by the activities shown in the first column of Table 10.5 below. The second column shows PIs for that activity, the third column shows what the activities affect, and the fourth the frequency of the skill raising activity.
Table 10.5
| Activity to Raise Skill Levels | PIs for These Activities | What These Skilling Activities Affect | Frequency of Activity |
|---|---|---|---|
| Formal training for trainees |
|
|
Annually |
| Formal promotional training from junior to senior | As above. |
|
Annually |
| Formal monthly upskilling or refresher training |
|
|
1 day per month |
Fig 10.7 shows the SCS extended to include the three PIPs, which became an integral part of the structure when management decided to implement the improvement strategy (Sec 10.7 refers). PIOs, PIs and KPIs are also shown in Fig 10.7. While PIOs are considered as KPI they are shown as PIOs.
A KPI is individual productivity. As skills levels increase individual productivity should also increase, thus increasing work capacity of the lands office. The importance of increasing individual productivity was brought out in the two previous examples. Values of individual productivity per month can be estimated from tasks processed/total staff numbers. This KPI needs close regular monitoring. If it does not increase then the improvement strategy to raise skills is not working, or other factors are in play. In either case management action is necessary.
Another KPI is demand compared to supply; ie (new tasks, rework, backlog) compared to the work capacity of the land office. In Sec 10.6.2 Risk #2 was that it seemed that demand would become greater than supply in ~ month 72. This was a KPI also used in the improving quality example in Chapter 9. This KPI compares work to be done (applications submitted for processing (a PI), rework (a PIO), backlog (a PIO) to land office work capacity (a PI). This KPI is important as it gives an early indication of when demand might consistently exceed supply, causing the backlog to rise. The improvement strategy in Table 10.4 listed actions to examine this mid term risk.
Fig 10.7
The PIs, KPIs and PIOs that need the closest and regular M&E
Fig 10.7 allows causal links and dependency traces to be carried out. More detailed work would need to be carried out to develop an operational M&E plan. It can be argued that Table 10.6 reflects priorities.
Table 10.6
| Priority | PIO / KPI / PI | Type |
|---|---|---|
| 1 | Individual productivity | KPI |
| 1 | Work to be done compared with work capacity | KPI |
| 1 | Rework | PIO |
| 1 | Results from formal training, including trainees, junior-to-senior promotion, and in-house upskilling. Results to include number and percentage completing, and skills gained. | PIs |
| 2 | Remaining PIOs and PIs | — |
Using the KPIs & PIs, and the SD model as a LBM to manage
The steps in using the model as a LBM to manage were listed in Sec 4.2.2. The application of these steps was shown in Sec 7.2.2 for the first backlog model and in Sec 9.8 for the second example of upgrading quality.
The application of these steps is not shown for this example but is fairly straight forward once actual data has been collected for the KPIs/PIs as implementation progresses.
10.9 What this example showed, its value, things that could be included
What this example showed
This example has shown:-
- How possibilities to improve staff development can be tested using the SD approach
- How an improvement strategy can be determined and include risk mitigation
- The KPIs and PI to be used for M&E when using the SD model as a LBM
- How multiple PIOs can be achieved
- How an intangible, morale, can be incorporated into a model
The value of this example
The value of this example is:-
- That it provides a view of how staff development works; what skills are required, what level skills are at; the rate at which skills are acquired and decay; the quantum of skills that are lost when staff leave, and how affected by high departure rates.
- It draws attention to important aspects of skills. e.g. what skills are needed to do the job; what constitutes each skill; how many are there; what is the current level of skills; how can skills be gained; what is the rate at which skills are gained, and forgotten; what affect does different skill levels have on individual productivity, rework, staff leaving
- That it illustrates how the performance of a system can be improved by changing the structure of the system. The structure was changed by introducing:- formal training of trainees; formal promotional training from junior to senior staff; formal monthly inhouse upskilling and skill retention training. [In Chapter 8 Sec 8.5 it was noted that there are different places to intervene in a system, and they have different power.]
- The model can be considered a working hypothesis of staff development. If there are other views, it provides a basis for discussion and the modelling of alternatives.
- It identifies KPIs and PIs on which actual data can be collected during implementation, compared with model POT trajectories, and the model improved to better reflect the real world and produce improved future targets
- As stated for previous examples, the important point is not the results from this example but the use of the SD approach which is logical, quantitative and transparent, with no implicit assumptions or hidden hard wiring. If one does not agree with the logic and structure of the SCS or the structure of the SD model, then it is relatively simple to develop an alternative SCS and SD model and use them
Some things that could be included in this model
The following could possibly have been included in the SD model:-
- “Train the trainer” skilling for selected senior staff who are going to conduct the various training.
- The relative attractiveness of land office salaries and job security and their effect on attracting trainees and staff retention
- The attractiveness of a once off bonus to staff who reach the target skill level within 1 year (say)
- Upskilling selected customer groups (eg Land trust officers, NGOs, lawyers, notaries, land agents, bank officers who handle mortgages, developers), who deal frequently with the lands office
While these would have added more detail to the model, it is unlikely that they would cause a significant change to the improvement strategy.
How this model could be used to extend the model of the previous example
This model is essentially focused on the supply side. It aims to improve staff development and skills acquisition and retention, and hence improve work capacity. The example in Chapter 9 was focused on upgrading quality, winning back customers, increasing revenue and using a small % of the increased revenue to achieve adequate annual O&M budgets to ensure sustainability of improvement, post IDA. Fig 9.15 shows the main parts of the model for the previous example. It would be reasonably simple to incorporate the expanded supply side model of Chapter 10 into the model of Chapter 9.
10.10 Key Points
- This example shows how the SD approach can be applied to the challenges of staff development and skills improvement. There are multiple improvement objectives.
- There are a number of SD structural building blocks for staff development which can operate stand alone or be linked together with other SD building blocks used in prior examples. These other structures can relate to demand, supply servicing demand, and all related by feedback loops.
- As in the two previous examples, this example shows how PIPs (performance improvement proposals) can be tested for effectiveness and sustainability, and an improvement strategy identified which includes risk mitigation.
- The value of this example is:
- It draws attention to important aspects of skills. e.g. what skills are needed to do the job; what constitutes each skill; how many are there; what is the current level of skills; how can skills be gained; what is the rate at which skills are gained, and forgotten; what affect does different skill levels have on individual productivity, rework, staff leaving
- It shows how a considerable improvement in performance can be obtained by changing the structure of the system (compared to simply improving flow rates) at a very low cost
- The model can be considered a working hypothesis of staff development. If there are other views, it provides a basis for discussion and the modelling of alternatives.
- Again this example and the results shown are not the most important part. The important aspect is how the SD approach can be used. If one does not agree with the logic and structure of the SCS or the structure of the SD model, then it is relatively simple to develop an alternative SCS and SD model and use them. The most important point is that the SD approach is logical, quantitative and transparent, with no implicit assumptions or hidden hard wiring.
- Not all PIP have equal impact. There are different places in a system to intervene, and they have different power (Chapter 8 Sec 8.5).
ANNEX A
Why, Why, Why, diagram
| Problem | Why | Why | Why |
|---|---|---|---|
| Skill levels are low | Staff learn by observing others on the job. | There is no structured training, and senior staff and other staff are not keen to help. | It is the way it has always been done. |
| Reasonably high staff turnover | Staff go to something more interesting and fulfilling. | — | — |
| Staff morale and interest in the job are low | Low confidence in ability to do the job properly. | — | — |
| Many customers complain. | — | — |
ANNEX B
Sketches of Indicative Effects of Graphical Functions
ANNEX C
| Abbreviation | Meaning |
|---|---|
| IDA | International Development Assistance |
| IRLR | Initial Recording of Land Rights |
| KPI | Key Performance Indicator |
| LA | Land Administration |
| LBM | Living Business Model |
| LO | Lands Office |
| LR | Land Registry |
| M&E | Monitoring and Evaluation |
| PI | Performance Indicator |
| PIO | Performance Improvement Objective |
| POT | Performance over Time |
| PTIP | Proposal to Improve Performance |
| SD | Strategy Dynamics |
Footnotes
- 1 Attributes are treated as co-flows in the terminology of system dynamics. ↩
- 2 This PIP is not a core part of staff development but is included to illustrate a point which will be made in Table 10.3??? ↩
- 3 The Sysdea software became Sheetless in 2020 and Silico in 2021. The dependency trace is anticipated to be implemented in Silico ↩