CHAPTER 9
UPGRADING THE QUALITY OF A LAND REGISTRY:
& IMPROVING REPUTATION; WINNING BACK CUSTOMERS;
INCREASING REVENUE; FINANCING SUSTAINABILITY
9.0 Introduction
9.1 This example
9.1.1 The setting and situation
9.1.2 Identifying the PIOs
9.1.3 The POT graphs of the PIOs for past, desired and feared future performance
9.1.4 A Why, Why, Why diagram and initial observations re the dynamics in play
9.1.5 What constitutes quality of a Land Registry (LR)
9.2 The System in which performance is to be improved
9.2.1 The System
9.2.2 The SCS of the system in which performance is to be improved
9.2.3 Additional PIs (performance Indicators) of the system and their POT graphs
9.2.4 Showing effects of graphical functions
9.2.5 What the SCS is indicatingqualitativelyabout the dynamics in play with no IDA
9.2.6 The PIPs (Performance Improvement Proposals) with IDA
9.3 Some System building blocks for the winning of customers and automating decisions
9.4.1 The customer pipeline
9.4.2 The Bass diffusion (Word of Mouth) structure
9.3.3 Structure to automate decisions [to increase staff when a work pressure threshold is reached]
9.4 Building and using the SD model for testing PIPs – a 1st Pass
9.4.1 Building the SD model – a 1st pass
9.4.2 Showing that the SD model can replicate past behaviour
9.4.3 Testing each PIP for effectiveness and sustainability - a 1st Pass
9.4.4 Conclusion from testing each PIP for effectiveness and sustainability
9.4.5 Some asides
9.4.6 Identifying the improvement strategy- a 1st Pass
9.4.7 Risk Management, What Ifs, Risk Mitigation, and modifications to improvement strategy
9.4.8 Gantt Chart– 1st Pass
9.5 Project Financials and Assessment – a 1st pass
9.5.1 Costs
9.5.1.1 Project Costs (once off)
9.5.1.2 Annual & recurring O&M costs – with and without project
9.5.2 Revenue - without and with the project
9.5.3 Financials at a glance
9.5.4 Project Evaluation – 1st Pass
9.5.4.1 Project evaluation - financial
9.5.4.2 Project Evaluation – Non Direct financial considerations
9.5.4.3 Summary of Project evaluation
9.5.4.4 Is the project worth investment?
9.6 What could be done in the 2nd Pass: A time to do rather than more planning
9.7 Using the SD model as a LBM (living business model) for M&E
9.7.1 KPI/PIs to be monitored
9.7.2 Performance Status –at 3 months before the end of IDA
9.7.3 Performance Status –at 7 months after the end of IDA
9.7.4 Setting revised performance targets for quality and calculating revised targets for dependant PIs
9.8 The importance of determining an appropriate aim (PIOs)
9.9 What has been shown in this chapter
9.10 Key Points
Tables
9.1 PIP (proposals to improve performance)
9.2 A 1st pass at indicative inputs, indicative and orders of magnitude only.
9.3 PIOs used to test the PIPs for effectiveness and sustainability
9.4 Major risk identification and qualitative effects
9.5 What Ifs and what they indicate quantitatively
9.6 A summary of financial data for without and with the project
9.5 Actions recommended to LR management from M&E at 3 months before the end of IDA
9.5 Actions recommended to LR management from M&E at 7 months after the end of IDA
Figures
9.1 POT graphs of the PIOs for past, desired and feared futures
9.2 The SCS (schematic of the core structure)
9.3 Additional PIs (performance Indicators) of the system
9.4 SCS with PIPs
9.5 SCS with PIPs and financials
9.6 An illustration of a customer pipeline structure.
9.7 An illustration of the Bass diffusion WOM (word of mouth structure)
9.8 An illustration of structure for an automated decision on staffing
9.9 An outline of the SD model
9.10 Some results of seeing if the model will replicate past POT
9.11 Results of testing the PIPs for effectiveness and sustainability -1st pass
9.12 Gantt Chart – 1st pass
9.13 Revenue collected and revenue missed with and without the project
9.14 Financials with and without the project
9.15 KPIs/PIs positioned in an image of the model
9.16 KPIs/PIs with traffic lights indicating degree of attention required 3 months before the end of IDA
9.17 KPIs/PIs with traffic lights indicating degree of attention required 7 months after the end of IDA
9.18 Revised future performance targets based on quality remaining at 0.8
9.19 Revised future performance targets based on quality at 0.8 for 12 months and then increases to 0.95
Annexes
A. The Why, Why, Why diagram
B. The SCS (schematic of the core structure)
C 1st pass at effect of .. on.. graphs
D. Comments of each PIP
E. The logic and outline mechanics of each PIP
F. Some comments on the testing each PIP for effectiveness and sustainability
G. Asides from testing for effectiveness and sustainability
H. Abbreviations used
CHAPTER 9
UPGRADING THE QUALITY OF A LAND REGISTRY:
IMPROVING REPUTATION; WINNING BACK CUSTOMERS;
INCREASING REVENUE; FINANCING SUSTAINABILITY
9.0 Introduction
Context
Chapters 4-7 showed in some detail the Strategy Dynamics (SD) approach and its application to the simple development task of removing a backlog in a land registry (LR) (with IDA) and keeping it low (post IDA).
In this and following chapters more complex examples of the use of the SD approach will be illustrated. Each example will be covered in a single chapter where the main part of the chapter focuses on the LA (land administration) development setting, the performance improvements objectives (PIOs), the development of a SCS (schematic of the core structure) of the system, and results obtained from testing PIPs (performance improvement proposal) for effectiveness and sustainability. Detail will mostly be in Annexes.
The purpose of this chapter
- To provide an example of aiming to achieve multiple improvement objectives
- To include intangible assets, e.g. quality1 and reputation
- To build on the backlog example and system which comprised:- Supply; Demand; Supply servicing Demand
This example is also set in a LR. The importance of a LR was previously discussed in Chapter 4 Sec 4.4.3.
Acknowledgements
When dealing with product quality, reputation, winning customers and automating decisions, this chapter largely follows the logic and illustrative models of Warren’s (2019) online extensions modelling course2,
9.1 This example; PIOs (performance improvement objectives) and POT (performance over time) graphs
9.1.1 The story line for this example
The setting - A semi-rural LR with eight staff (There are other land officers who conduct upstream activities)
The Situation - approx. 3 years ago – aid was provided to remove a processing backlog and to improve individual productivity and overall processing capacity. The improvements have proved to be sustainable as the backlog has been kept low.
The Situation now-
- The LR holds in the order of 100,000 titles and it is guestimated that about 20,000 titleholders do not use the LR to record any changes (e.g. selling, inheritance, subdivision) in property rights and interests.
- The quality of LR and its reputation are perceived by customers and the community to be not that high,(~ 0.5 on a scale of 0 to 1).Titleholders who do not currently use the LR (guestimated at ~20% of titleholders) tend to see little value in putting their property transaction through the LR, and paying the associated fees and government taxes on property transfers. Also, there have been occasions when there have been long waiting times (several months) for land dealing to be processed.
- Government would like to see titleholders currently not using the LR return to using the LR, and thereby increase revenue to the government
- The LR is not well equipped. There are some old computers and some records have been computerised. There is little turnover of LR staff as it is regarded as a secure government job even though the salary is low. The annual O&M (operation and maintenance) budget generally just covers staff salaries, leaving little for operating expenses and regular equipment maintenance, or for the replacement of existing equipment or purchase of additional equipment. Equipment maintenance, etc. is expensive because of exchange rate of ~5 local $ to the US$.
Initiative by management
IDA (international development assistance) has been requested to assist in achieving improvements. Senior management of the Land Agency is considering using the quality improvement at this small LR as a pilot which, if successful, could lead to a progressive roll out to many other LRs.
9.1.2 Identifying the PIOs (Performance Improvement Objective)
This is step 1 in the SD approach (Sec 4.2.2 refers).
The PIOs identified in discussions with the IDA team and LR management were:-
- To significantly improve the quality and reputation of the LR
- To increase the number of titleholders using the LR (by winning back a significant % of the titleholders who do not currently use the LR)
- To increase revenue to government (from fees from those won back to using the LR)
- To maintain very low backlogs and waiting times for the processing of applications
- To make all above improvements sustainable by using some of the increased revenue to provide adequate annual O&M budgets and to establish a sinking fund
This example seeks to achieve multiple improvement objectives and is more complex than the first example of removing a backlog.
9.1.3 POT graphs of the PIOs for past, desired and feared futures
This is step 2 in the SD approach. The POT graphs are shown in Fig 9.1.
Fig 9.1
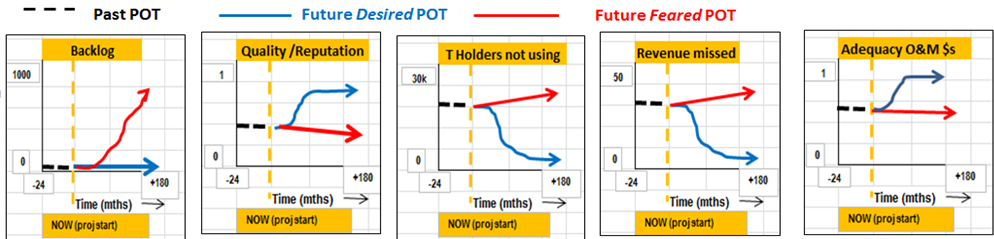
Comments on Fig 9.1
- The POT graphs have the same form as used in Chapter 4 and show past behaviour (black trajectory), feared future trajectory (red trajectory) and desired future trajectory (blue trajectory). Now time is year 1. The horizontal axis is time in months. Past is approx. the last 3 years; Future is the next 10 years. Vertical scales showing quantities are best estimates from incomplete sources.
- The units for the vertical axes are:- Backlog- applications awaiting processing; Quality & Reputation – relative 0-1;Titleholders not using the LR- thousands of titleholders; revenue missed-thousands of local $s; Adequacy of O&M budget $s- relative 0-1
- Reputation is similar to quality but lags it by about 6 months
- If the backlog is low so will be waiting time
9.1.4 The Why, Why, Why diagram and initial observations re the dynamics in play
This diagram is shown in Annex A. As indicated in Chapter 4 diagrams of this type are useful for providing an initial insight into the situation and the dynamics at play. A first pass indicates:-
- The issue is that ~20% of titleholders currently do not use the LR for their property dealings; the Government wishes to increase revenue by capturing some of the lost fees and charges.
- The root cause seems to be the low quality of the LR as exhibited by its service and records/documentation veracity.
- The dynamics seem to be that the low quality of the LR results in the LR having a low reputation with customers/the community which in turn causes more titleholders not to use the LR. As fewer use the LR revenue collected drops, and the inadequate allocated O&M budget is in danger of being further reduced.
- A possible solution is thought to be that if quality can be significantly increased, and be seen to have increased by customers/the community, then the reputation of the LR will increase, and that titleholders will see value for money by putting their property dealings through the LR.
9.1.5 What constitutes “quality” of a Land Registry (LR)
For the purpose of this example the quality of the LR is taken as comprising a single entity, with a relative scale of 0 to 1.
In reality there are many aspects to quality of an LR and one way of looking at these various aspects could be to use sub aspects of:- infrastructure; services; records; financials; integrity. A list could be developed of what could be included in each sub aspect. In Chapter 11 an example is provided where the quality of an LR is treated as being composed of a number of sub aspects, all of which require improvement, but are at different quality ratings and have different quality targets.
9.2 The System in which performance is to be improved
This is step 3 in the SD approach.
9.2.1 The System
The system to be improved is similar to that of the first backlog example, with the addition of quality and reputation. It comprises:-
- A demand side including both titleholders who use and do not use the LR; the generation of applications for lodgement with the LR; the reputation of the LR as perceived by customers and the community.
- A supply side including:- staff of the LR, individual productivity and group work capacity; the quality of the products and services of the LR
- A supply servicing demand side where supply aims to meet demand by the LR processing the applications that customers lodge in a timely manner
- A financial side including revenues collected from applications lodged; the O&M (operations & maintenance) costs of operating the LR; the once off cost of IDA
- Feedback loops operating within the above.
Figure 9.2 shows a diagram of this system.
9.2.2 The SCS of the system in which performance is to be improved
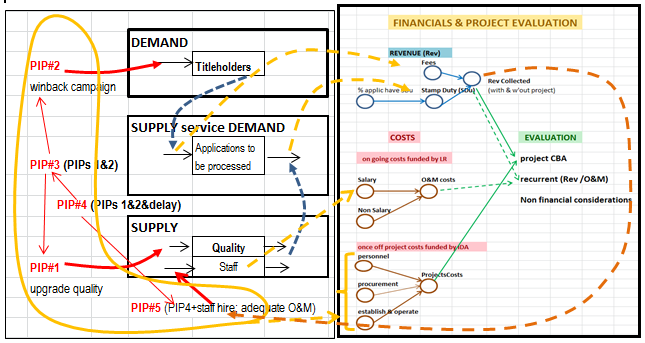
Fig 9.2 below shows the SCS with the Demand side including reputation, the Supply side including quality, supply servicing demand segment and effect of (feedback) loops. Financials are shown more fully in Fig 9.5. Annex B shows an enlarged Fig 9.2.
Fig 9.2
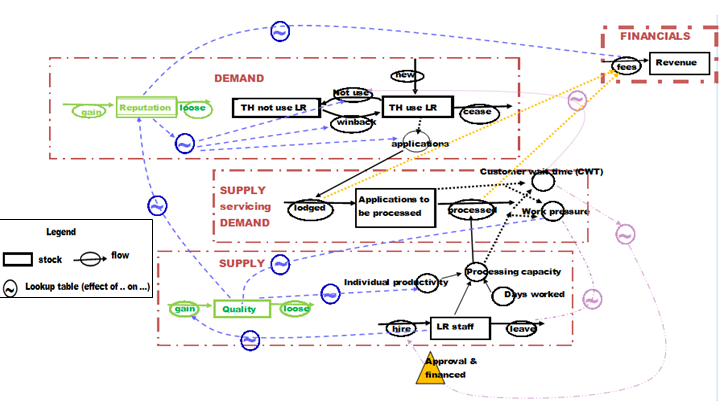
Comments on Fig 9.2
- Operationally a 1st pass at the SCS would be hand drawn and may be simpler as shown in Chapter 4
- The structure in black is essentially the same as that used in the first backlog example (Fig 4.21 refers). The addition is a stock in Demand, TH not use the LR, (titleholders who do not use the LR). The feedback loops in lavender are the same as from the first backlog example
- The stocks and flows in green are for quality and reputation. The associated feedback loops are in blue
- The various feedback loops are depicted in blue. There are many more than in the backlog example
- Dashed lines indicate that not all variables and links necessary for computation are shown; i.e. only main logical paths shown
- The current values of the main stocks are shown in Fig 9.1 together with desired and feared future trajectories
- Operationally in country Fig 9.2 can be drawn on butchers paper several time when brainstorming
9.2.3 Additional PIs (performance Indicators) of the system and their POT graphs
The PIOs (Fig 9.1 refers) are all KPIs (key PIs). Additional PIs can be identified from the SCS (Fig 9.2) and these are shown with their POT graphs in Fig 9.3. Their identification follows the process described in Chapter 4 Sec 4.8.2.
Fig 9.3
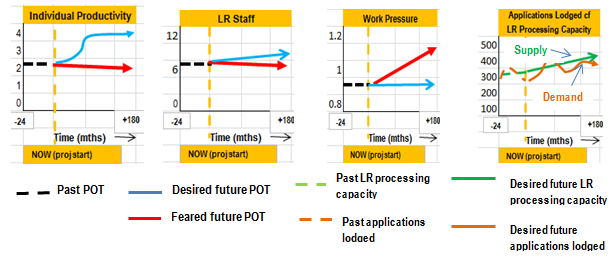
Comments on Fig 9.3
- Vertical scales showing quantities are best estimates from incomplete sources.
- The vertical scale units are:- Individual productivity – application processed/person/day; LR Staff – number of; Work pressure – ratio (applications lodged/month + backlog)/LR processing capacity; Application lodged/ cf LR processing capacity - applications
- As the backlog is very low/ negligible, and processing capacity averages out as less than applications lodged, the work pressure is just less than 1, on overage.
- The overall desire is to keep LR processing capacity just greater than applications lodged on the average. That way there will be no out of control backlog and work pressure will be less than 1, except for occasional short periods.
Applications lodged are expected to increase as titleholders are won back. Processing capacity is anticipated to increase due to individual productivity increasing as quality increases, and by staff being incrementally increased as O&M budgets increase in adequacy.
9.2.4 The effects of graphical functions
The SCS in Fig 9.2 shows that there are a number of symbols indicating an effect of one factor on another. e.g. effect of waiting time on titleholders who stop using the LR. Annex C shows a sketched quick 1st pass at what the graphical function might look like. During the model building there will be changes as to their form and how they are handled.
Operationally, as a 1st pass in design, it can be useful to have a large version of Fig 9.2 with the POT graphs of Fig 9.1 and 9.3 and the form of the graphical functions superimposed to help focus and understanding.
9.2.5 The dynamics in play with no IDA - what the SCS is indicatingqualitatively
From the Why, Why, Why diagram (Annex A) initial thoughts on the dynamics in play were drawn (Sec 9.2.3 refers). Figs 9.2 and 9.3 allow firmer thoughts on the dynamics in play to be drawn.
The current quality of the LR and its reputation are estimated to be ~0.5 (on a scale of 0 to 1). It has had these values for some time. Changes to reputation lag changes in quality by about 6 mths. Low quality and reputation over a long period has led to ~ 20% (20,000) titleholders currently not using the LR to record their land transactions. This in turn has led to a loss in revenue.
The processing capacity of the LR can currently just keep up with the applications being lodged. There is less than 1 months delay in processing. There is no spare capacity in the LR to significantly improve quality. If some LR staff are absent for some period, or there is a large increase in applications being lodged, the backlog and waiting time for processing increases, and quality and reputation decreases, leading to some titleholders who currently use the LR, moving to join those who do not use the LR, causing a further decrease in revenue.
Increased backlog and waiting times are likely to increase the work pressure on LR staff. Some may leave causing LR processing to decrease, the backlog and waiting time to further increase, quality to decrease, and more title holders to leave. So the vicious cycle goes on.
9.2.6 The PIPs (performance improvement proposals)
The PIPs
From discussions during design between an IC group from the LR/Land Agency and an IDA group a list the improvement proposals emerged. Table 9.1 refers.
Table 9.1
| No. | Performance Improvement Proposals (PIPs) |
|---|---|
| 1 | Significantly upgrade the quality of the LR. |
| 2 | Conduct a campaign to win back those titleholders currently not using the LR. |
| 3 | Conduct PIPs 1 and 2 concurrently. |
| 4 | Conduct PIPs 1 and 2, with PIP #1 starting at project start and PIP #2 commencing only when the reputation of the LR reaches a designated level of approximately 0.73. |
| 5 | PIP #4, plus using some of the increased revenue to fund additional LR staff to maintain the increased quality, handle increased processing, achieve adequate O&M budgets, and establish a sinking fund (SF)4. |
Annex D contains comments of each PIP.
A 1st pass at indicative inputs
Table 9.2 shows a 1st pass at indicative inputs, durations and anticipated improvement.
Table 9.2
| No. | PIP | When Start | Persons IDA Funded |
Approx. Duration Months |
Other Resources IDA Funded |
Anticipated Improvements |
|---|---|---|---|---|---|---|
| 1 | Upgrade quality of LR. | At project start. | 4 x TA 18 x local |
10 | Local $250k for technology. | Quality and reputation increase from approximately 0.5 to 0.9. |
| 2 | Conduct a marketing campaign to win back titleholders not using the LR. | At project start. | 1 x TA 2 x local |
12 | Local $180k for marketing and engagement. | Win back approximately 13k of 20k titleholders not using the LR. |
| 3 | Do PIPs 1 and 2 concurrently. | At project start. | As above. | 12 | As above. | As above. |
| 4 | Do PIPs 1 and 2, but only start PIP #2 when the reputation of the LR reaches approximately 0.7. | PIP #1 at project start. PIP #2 when reputation reaches approximately 0.7. |
As above. | 18 | As above. | As for PIP #1. Win back approximately 17k of 20k titleholders not using the LR. |
| 5 | PIP #4, plus additional LR staff for quality assurance, increased processing, increased staffing and adequate O&M. | As for PIP #4. | As above. | 18 | As above. | As for PIP #4. Sufficient staff. Sufficient O&M funding for sustainability. Sinking fund established. |
The SCS showing PIPs
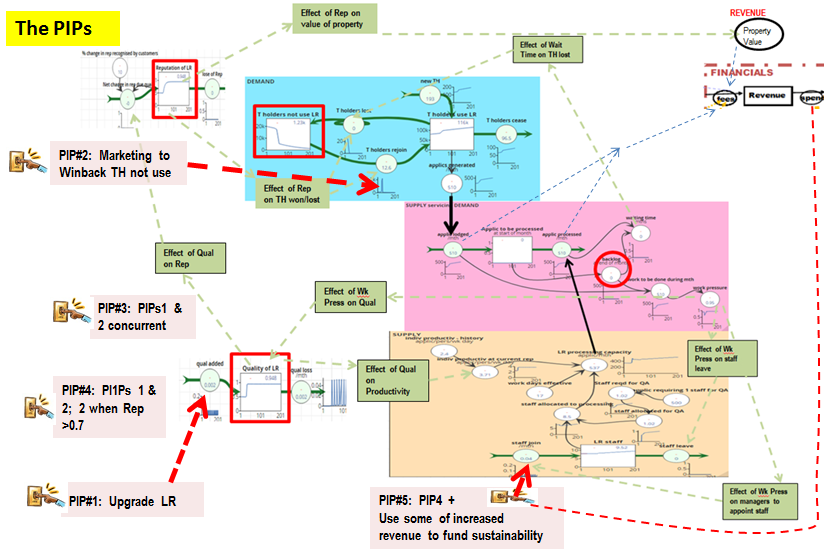
The SCS including PIPs is shown below as Fig 9.4. The PIPs are shown in the yellow boxes and the thick yellow arrows show what part of the system is affected by each PIP. Switches indicate that individual PIPs can be made active or inactive. These PIPs will be tested quantitatively in Sec 9.4 for effectiveness and sustainability using the SD model and then an improvement strategy determined. Fig 9.5 shows a barebones structure of the SCS which includes the financials and project evaluation.
Fig 9.4
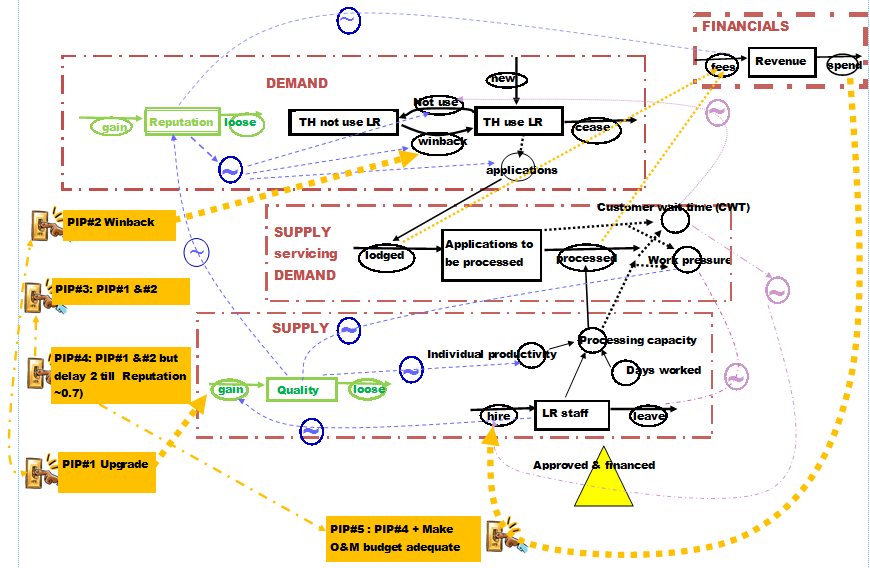
Fig 9.5
9.3 Some System building blocks for winning customers and automating decisions
PIP#2 is a marketing campaign to win back titleholders who no longer use the LR. PIP#2 is also part of PIP# 3, 4 & 5. This is essentially the same as seeking to win customers in a for profit commercial situation, or a not for profit seeking to attract more donors.
In system dynamics there are two commonly used structures for winning customers, a customer pipeline structure (Sec 9.3.1 refers) and the Bass diffusion WOM (word of mouth) structure (9.3.2 refers) . Each of these are briefly outlined as they are used in the SD model for PIP#2,3,4 &5. No further detail will be provided as that is beyond the scope of this booklet.
PIP#5 includes automatically increasing LR staff numbers when the work pressure reaches some threshold value. The structure to determine when the threshold is reached and to automate a staff increase is outlined in Sec 9.3.3.
9.3.1 The customer pipeline
Fig 9.6 illustrates a customer pipeline structure.
Fig 9.6
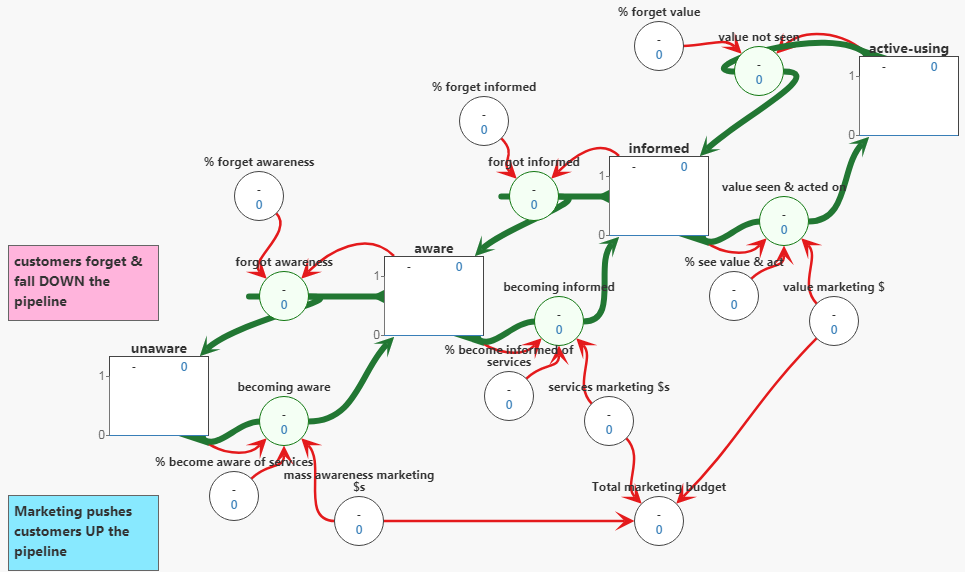
Comments on Fig 9.6
- There are four stocks each representing a particular type of customer. Unaware, aware and informed are different types of potential customers. Active-using are actual customers, or in the case of the LR, titleholders who use the LR.
- Marketing is necessary to move some customers up the pipeline. Marketing with its budget provides the flow (e.g., becoming aware) from one named stock to another. The flow rate is determined by the amount of budget, its coverage and effectiveness
- Unfortunately, some customers forget or no longer see value in the product or service and fall down the pipeline. There will be different rates of forgetting
- The red lines indicate incomplete computational paths.
- The flow value seen & acted on is equivalent to the flow TH won back (Titleholders won back) in Fig 9.4 This structure is logically similar to Fig 9.6 is used in the SD model in PIP#2
9.3.2 The Bass diffusion WOM structure
Fig 9.7 illustrates the Bass/WOM structure between customer stocks, informed about service (the LR) and using service.
Fig 9.7
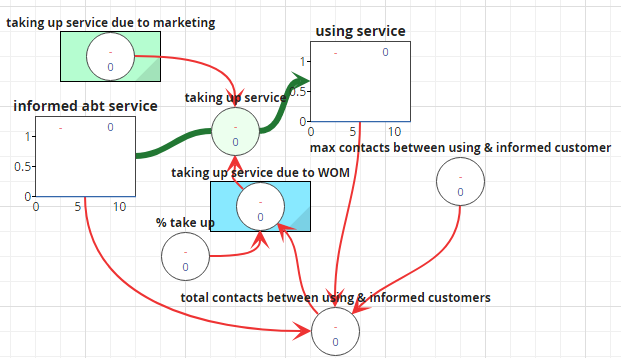
Comments on Fig 9.7
- The red lines indicate incomplete computational paths.
- WOM (word of mouth) is where customers not using a service/product are “won” by meeting a happy user and acting on their recommendation
- The variable outlined in green is those customers won by marketing (Fig 9.6); The variable outlined in blue is those customers won by WOM
- It make sense to carry out heavy marketing early to move potential users up the pipeline of Fig 9.6 and then cut back on wide advertising and focus on value advertising and then allow the WOM mechanism to do the work of winning the informed to become users (This is the thrust of PIP#2)
- The point immediately above will only work if users are happy with the service and will recommend using it to others. e.g. The LR enjoys a high reputation. In the story line of this example (Sec 9.1) the reputation of the LR is medium due to the quality of the LR being medium. The focus of PIP#1 is to upgrade the quality of the LR so that its reputation with users and the community rises. The focus of PIP#4 & 5 is to delay PIP#2 (the winback marketing campaign) until both quality and reputation have increased so that marketing will be more effective
9.3.3 Structure to automate decisions [to increase staff when a work pressure threshold is reached]
Figure 9.8 illustrates a structure to automate increasing staff when a maximum work pressure target/ threshold (in this case 0.95) is reached, and also when the Treasury Department has approved the expenditure of revenue to fund the new staff hires. These are shown in the blue boxes.
The decision to hire additional staff rests on setting a target for maximum work pressure and comparing that to the actual work pressure. If actual work pressure is greater than target work pressure then additional staff are hired in line with a formula. This establishes an information feedback loop, where the information is the difference between target and actual performance. This feedback loop is highlighted in Fig 9.8. It is a balancing loop as work pressure is reduced as more staff are hired. .
Fig 9.8
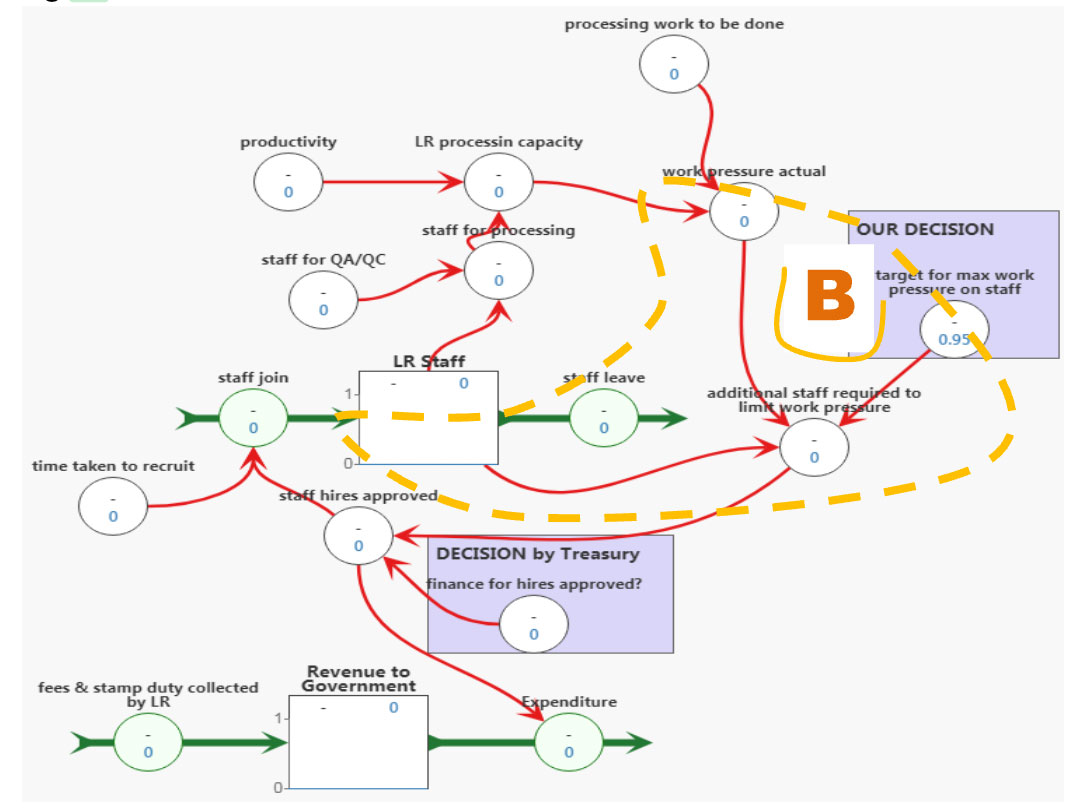
Comments on Fig 9.8
- A further decision could be included for the fraction of the staff required that is to be actually hired.
- Processing work to be done is determined by the number of applications lodged and the backlog
- The revenue to government and using part of that revenue to achieve an adequate O&M budget, and sustainability post aid is examined in Sec 9.6.
9.4 Building and using the SD model for testing PIPs – a 1st Pass
This covers steps 5 to 7 of the SD approach. It is not uncommon to do a quick 1st pass of a model (incl PIPs, but where the model may not be complete) with quickly available data to gain insights into results from the model. After a quick 1st pass, refinements and extensions can be made. This is the agile approach recommended by Warren (2014, 2018). A 1st pass is conducted in this section, while the next section (9.5) deals with financials based on this 1st pass. A 2nd pass is commented on in Sec 9.6.
9.4.1 Building the SD model – a 1st Pass
Building the SD model is step 5 in the SD approach.
An SD model was built based on the SCS of Figs 9.4 to 9.8. This model was considered a 1st pass. As noted in Chapter 1, the aim of this booklet is to explain the SD approach and show the results from applying it, but not to go into the detail of building a model5.
Fig 9.9 shows an outline of the main part of the model6. Annex E gives a brief indication of the logic and mechanics of each PIP. For more details on the model contact the author at [email protected].
Fig 9.9
Comments on Fig 9.9
- The three sections coloured blue, light brown and light red are respectively, demand, supply, and supply servicing demand with their three feedback loops. The structure of each of these is very similar to that used in the first example (Chapters 4 and 5).
- Quality, an intangible asset, is part of supply and has an effect on individual productivity and reputation. PIP7#1 is focused on increasing quality
- Reputation, also an intangible asset, is part of demand and has an effect on titleholders using or not using the LR, and also the value of property
- PIP#2, the winback campaign, aims to increase the number/stock of titleholders using the LR (and decrease the stock of those not using), thus increasing transactions and revenue
- PIP# 3 & 4 are particular combinations of PIP#1 & 2;
- PIP#5 is PIP#4 + using some of the increased revenue to achieve sustainability of quality, reputation and revenue
9.4.2– Showing that the SD model can replicate past POT
This is part of step 5 in the SD approach.
In the story line of this example there was no past data on quality or the reputation of the LR or on how loss and win rates of titleholders using the LR are affected by reputation. There was general agreement that quality and reputation were probably about ½ of what they should be (0.5 on a 0-1 scale). Best estimates were depicted in Figs 9.1 & 9.3. There was also no easily obtainable reliable data on revenue collected, property values, or the percent of transactions that attract stamp duty. Some data over the past two years could be estimated and this is shown in Fig 9.9 in red while the model trajectory is shown in blue. For Backlog the model trajectory (blue) cannot be seen as it is zero, and the actual backlog (red) is largely zero also except for a few small blips.
Fig 9.10
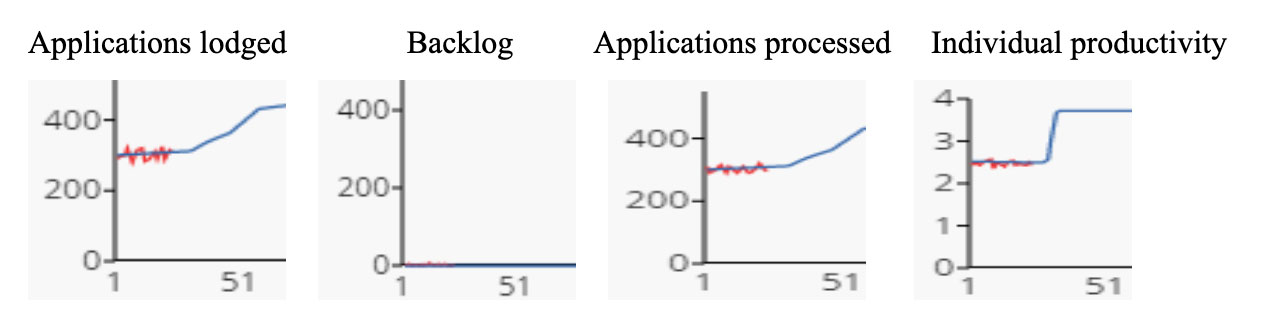
These results give some confidence that the SD model can reasonably replicate past POT for where data could be obtained.
A concern is the lack of data noted above and hence the inability to ascertain if the model can reliably replicate past behaviour. This lessens confidence in the model, and highlights the need for data to be collected as part of routine M&E (Sec 9.7). A lack of past data, or reliable data, or data sources that do not agree, is not uncommon in development activities.
9.4.3 Testing each PIP for effectiveness and sustainability - a 1st pass
This is step 6 in the SD approach.
The test for effectiveness and sustainability
The test for effectiveness and sustainability of a PIP is- how well does each of the future trajectories, generated by the model for each PIO (Fig 9.1) or other PIs (Fig 9.3), align with their desired future trajectory.
Which PIOs and PIs to use for testing PIPs in a 1st pass
Fig 9.1 showed the future desired trajectories for the five PIOs which are KPIs and Fig 9.3 identified some other possible PI. It was decided to use the following (Table 9.3) and to also use some of the graphing capabilities of the Silico software.
Table 9.3
| Performance Improvement Objectives (PIOs) | Remarks |
|---|---|
| Quality and reputation | Both are important, and significant sustained increases are sought. Reputation would lag quality by approximately 4–6 months. |
| Backlog | The aim is for backlog and waiting time to continue to remain low. |
| Titleholders who use and do not use the LR | The aim is to win back significant numbers of titleholders who are not currently using the LR. |
| Revenue collected and revenue missed | The aim is to significantly reduce revenue missed and increase revenue collected. This can only occur if titleholders who are not currently using the LR are won back. Without a significant increase in revenue, it is unlikely that additional funds will be available to make O&M adequate and thereby achieve sustainability post IDA. |
| Applications lodged compared to LR processing capacity | If processing capacity is not kept slightly greater than anticipated applications lodged on average, a backlog will accumulate. |
The financing of an adequate O&M budget will be covered in Sec 9.6 dealing with financials
The results from “testing” each PIP for effectiveness and sustainability - a 1st pass
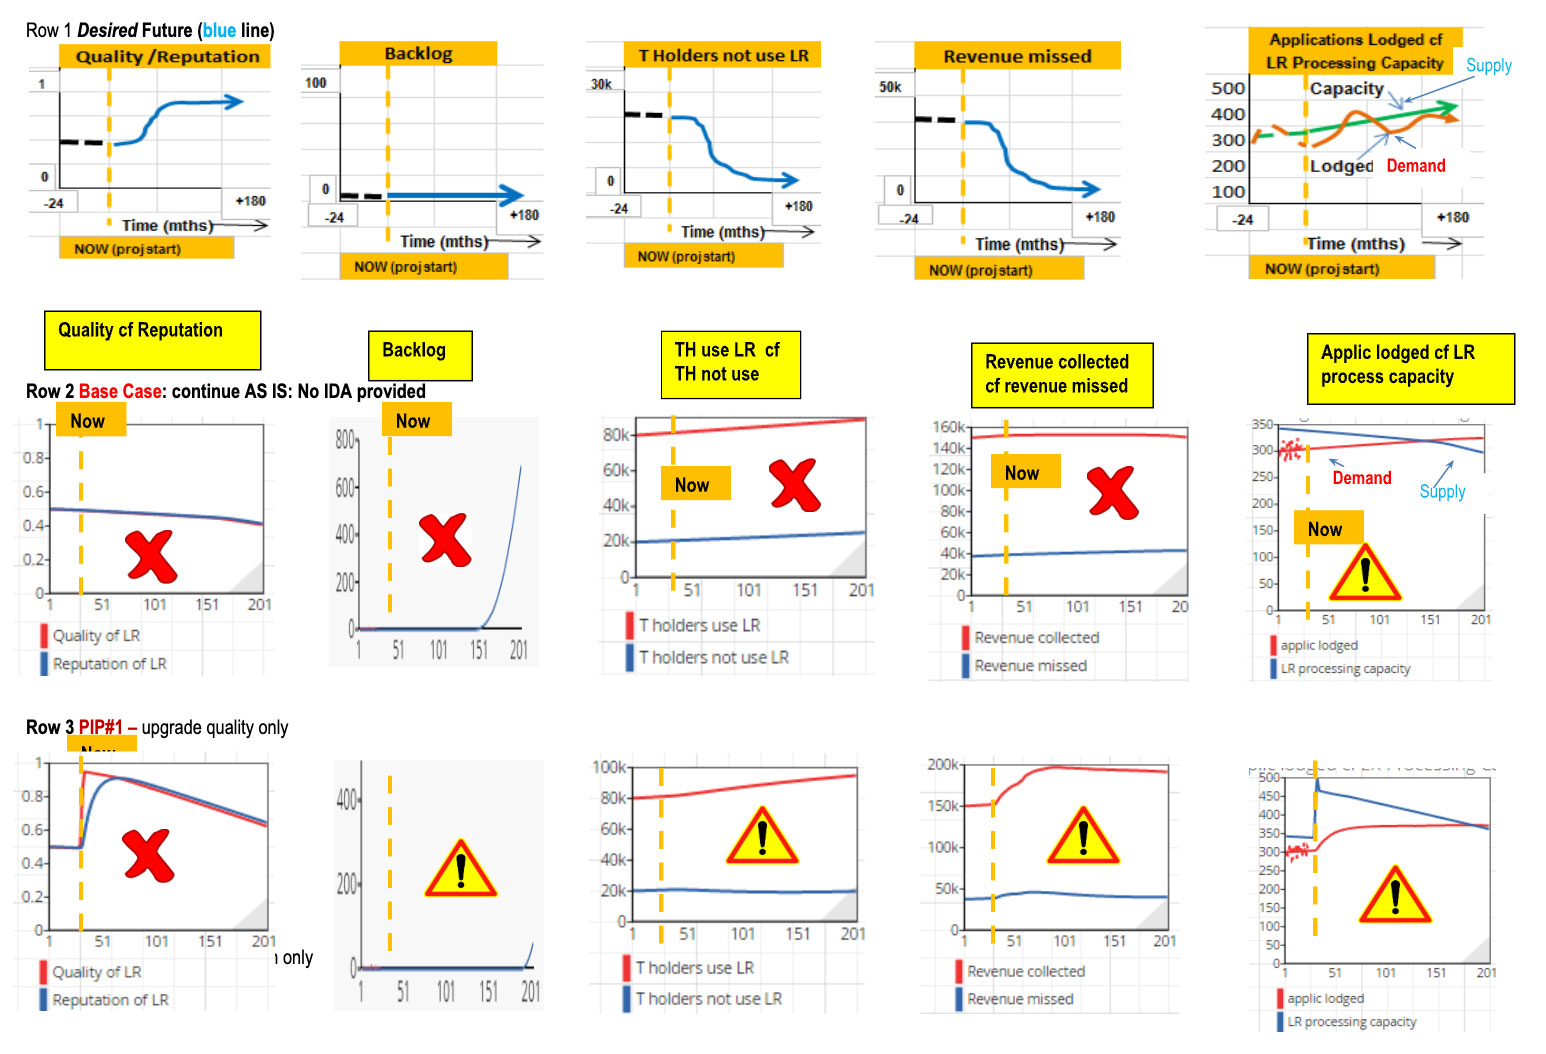
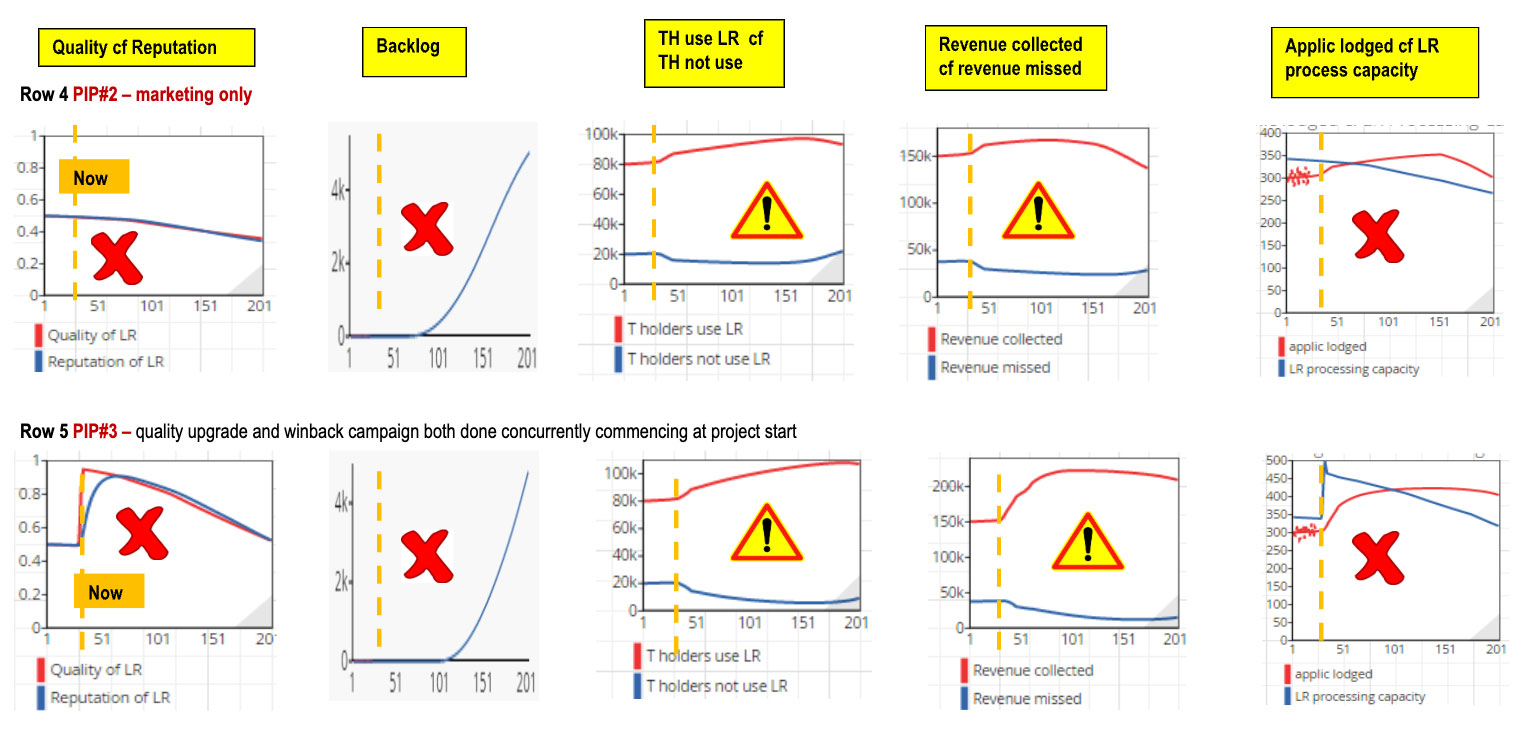
Fig 9.11 shows the results in a similar layout to that in Chapter 5 Fig 5.5 for the first backlog example.
Row 1 shows the desired future trajectories of the selected PIOs/PIs from Table 9.3. Row 2 shows the base case/continue AS IS (i.e. if no IDA provided). Row 3 on deals with each PIP in turn.
Fig 9.11 The results from “testing” each PIP for effectiveness and sustainability a 1st pass
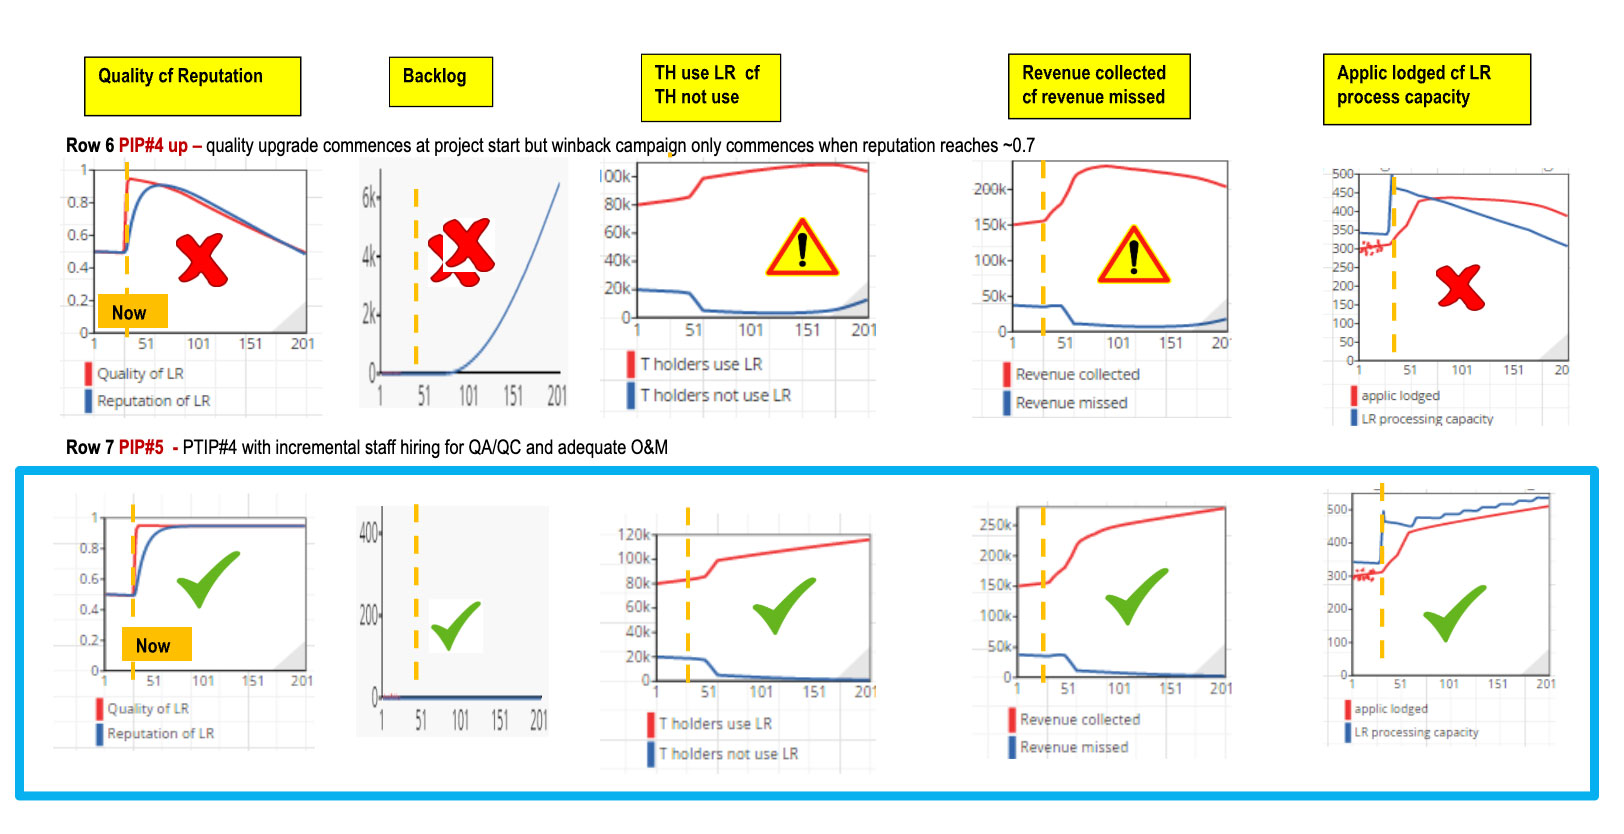
9.4.4 Conclusions from testing the PIPs for effectiveness and sustainability
It can be seen that PIP#5 (Row 7) is the only PIP in which trajectories all align well with the future desired trajectories (Row 1) and hence best achieves the PIOs. Therefore, the improvement strategy should be based on PIP#5, Sec 9.4.6 refers.
Comments on Fig 9.11
- It can be seen that PIP#5 (Row 7) is the only one that aligns well with the future desired trajectories (Row 1) and therefore best achieves the PIOs (project improvement objectives) (Sec 9.1).
- All other PIPs fail to achieve one or more PIOs. Some comments on the results of testing each PIP are provided in Annex F.
- In the cases where titleholders are initially won back and quality improvement reached but not sustained (eg PIP# 4, 3) there is an initial increase in revenue and processing capacity, but non maintenance of quality causes a decline in quality leading to decreases over time in individual productivity and processing capacity, increases in backlog and waiting time, a loss of titleholders who use the LR, and a loss in revenue.
- Caveat 1 - This is the result of a first pass using the model in a hypothetical example. The purpose of this example is to show how the SD approach can be used where multiple PIOs are sought to be achieved. Operationally, more passes would be done and a range of What Ifs considered e.g.:-
- The inputs allocated to increase quality are insufficient to reach the quality target
- Winback marketing campaign only half as successful as anticipated
- Insufficient staff allocated to QA/QC & to maintain quality
- The revenue allocated to O&M is cut by 50% ~3 years post aid
- Caveat 2 – It is only a model! An adage in system dynamics is that all models are wrong but some are useful. In Sec 9.4.2 concern was noted that there was no reliable historical data for rates of winning back titleholders, property values, or a breakdown of application types. Therefore caution needs to be taken with the use of this current model and its results. Having noted that, the model is considered useful as it clearly indicates that PIP#5 is the only one likely to lead to a significant sustained improvement in the PIOs. If the project were to proceed, the trajectories of the PIOs achieved would likely differ in detail from those shown in Row 7, but it would be anticipated that the trend would be along similar lines. M&E will be vitally important (Sec 9.7 refers).
9.4.5 Some asides
It is useful to briefly examine two aspects:-
- The absolute necessity to maintain quality, and what happens when quality is not maintained
- The ability of the LR to handle a sharp increase in new titles, through IRPR (initial recording of property rights)
Aside #1 -The absolute necessity to maintain quality, and what happens when quality not maintained
The results displayed in Fig 9.11 indicate clearly the impacts on other PIOs when the quality target/PIO is reached, but not maintained at the target level. To sustain the once off quality increase post aid, it is necessary that regular maintenance by the LR to maintain quality is equal to the routine quality losses.
In Aside 1 in Annex G maintaining quality is illustrated in more detail. The left hand side of the diagram shows:- the once off increase in quality via IDA; the three routine outflows to quality; the two maintenance inflows (it is the Land Agency’s decision what % of the necessary maintenance to actually provide). The right hand side of the diagram shows how quality decreases over time (reasonably quickly) for three different cases of insufficient routine maintenance.
Conclusion – if the LR does not allocate sufficient resources to maintain quality at the target level, then other PIOs, such as titleholders who use the LR and revenue, will also decrease and the backlog will increase. A significant decrease in revenue will most likely reduce the funds allocated to make the O&M budget adequate which will cause a further decrease in quality.
Aside #2 -The ability of the LR to handle a sharp increase in new titles, through IRPR (initial recording of property rights)
Aside 2 in Annex G looks at the impact on the LR of having ~500 new titles/month lodged in the LR for one year commencing about four years after the completion of the Quality upgrade and the winback campaign. The area shaded in red is the relevant model mechanics. Applying this, and examining the PIs used in Table 9.11for the PIPs, indicates that based on PIP#5, the LR could handle this increased workload without quality or reputation suffering because staff have increased from 9.4 to 10 due to the funding arrangements of the LR being allowed by the Treasury Department to use a small % of the revenue the LR generates to achieve and adequate O&M budget (Sec 9.5.1.2 refers).
Conclusion – The policy of ensuring adequate O&M by allocating a small amount of the additional revenue to O&M ensures that there will be sufficient resources to cope. 6,000 new titles will, over time, generate additional applications lodged in the LR, and lead to additional revenue.
Comment
This example using IDA to achieve a range of improvements in the LR of a small district, (as mentioned previously),
could be treated as:-
- a pilot for a scaled up roll out to LRs in many other districts, and .
- a site for a IRPR pilot with a view to also scaling up IRPR to other districts,
if sustainability could be maintained in the PIOs for ~ four years post IDA.
An example of scaling up and rolling out is provided in a later chapter. An example of IRPR is also provided in a later chapter.
9.4.6 Identifying the improvement strategy- a 1st pass
This is step 6 in the SD approach.
This first pass at the improvement strategy is based on PIP#5 as it is the one that produces future trajectories that most closely align with the desired futures.
The improvement strategy can be summarised as:-
With IDA
- Use temporary local staff, once off, for processing so as to rotate permanent LR staff to participate and be trained in upgrading and winback activities
- Use technical assistance personnel, temporary hires, rotated LR staff and others to:-
- Undertake upgrading activities to increase the quality of the LR from ~0.5 to ~0.9
- Undertake marketing & community engagement to win back customers and commence winback marketing when reputation increases to ~0.7
- Increase LR staff skills and productivity due to quality upgrades
- Prepare LR for post IDA
Post IDA
- Incrementally appoint extra staff as needed to: -
- conduct routine quality maintenance and QA/QC to ensure the quality of LR is maintained at ~0.9
- process the increased applications lodged,
- maintain the increased individual productivity,
- Ensure adequate O&M budgets for: -
- the adequate maintenance of all equipment, hardware, software that the IDA project installed for improving the quality of the LR, and any prior LR equipment and operating expenses,
- include regular skill retention training of LR staff to ensure continuing competency and productivity,
- adequate consumables,
- adequate staff salaries
- The establishment of a sinking fund for the replacement of equipment over time and its associated training
- The conduct of ~2-4 short annual vigorous community awareness campaigns on the advantages to titleholders of putting all land dealings through the LR, and what the LR is doing to ensure high quality
- Use some of the increased revenue to fund the above
The aim of the above is to ensure sustainability of the multiple PIOs, and the increased revenue stream to government; thereby ensuring the LR continues as the goose that lays golden eggs (Chapter 2, Sec 2.5, Fig 2.5). This would require the approval of the in-country Finance Department. In negotiations, the model and its results could be strong arguments. Sec 9.5 deals with the financials, the necessary increase in O&M costs for sustainability, and the funding of this from a % of the increased revenue due to the project.
9.4.7 Risk Management, What Ifs, Risk Mitigation, and modifications to improvement strategy
Chapter 5 Sec 5.5 showed a procedure used in the first backlog example, and this is largely followed here.
Major risk identification
As this is part of the 1st quick pass only major risks have been identified and are shown in Table 9.4
Table 9.4
| Risk | Likelihood | Effect |
|---|---|---|
| Risk #1 The targets for quality and/or winning back titleholders to use the LR are not achieved and/or sustained. |
Medium | Targets for other PIOs, including backlog, revenue and adequate O&M, would not be achieved due to the structure/physics of the system/model. |
| Risk #2 The amount of annual revenue negotiated with the Treasury Department to provide adequate O&M and build a sinking fund for the LR is not fully allocated, or is not used for the purpose intended. |
Medium | Long-term sustainability post IDA is put at risk. |
| Risk #3 The built SD model does not adequately represent reality. |
Medium | The future performance over time trajectories for PIOs and PIs generated by the model do not reasonably reflect reality. |
What Ifs and what they indicate (quantitatively)
A list of What Ifs, based on the risks listed in Table 9.4, could be drawn up and run through the SD model similar to the first backlog example (Sec 5.5.2 refers). In the case of this example this has essentially already been done, sufficient for a 1st pass, when testing the various PIPs for effectiveness and sustainability with the results shown in Fig 9.11. Table 9.5 comments on each risk, drawing on the quantitative POT graphs in Fig 9.11.
Table 9.5
| Risk | Quantitative Impact of Risk |
|---|---|
| Risk #1 Quality target not achieved or sustained. |
|
| Risk #1 Target for winning back titleholders to use the LR not achieved or sustained. |
|
| Risk #2 Agreed portion of revenue to sustain the LR not partially or fully provided, or used for other purposes. |
Aside 1, Annex G, shows quantitative graphs for the decay of quality under several conditions of inadequate funding for quality maintenance. |
| Risk #3 SD model not adequate. |
This will only become apparent during improvement if close monitoring and evaluation is carried out and the SD model is used as a Living Business Model (LBM). Its use as a LBM was shown in Section 7.2 for the backlog example and is shown in Section 9.7 for this example. |
Conclusions
- Failure to significantly improve and sustain quality post IDA, and to winback a significant % of titleholders currently not using the LR will result in other PIOs not being achieved
- If the agreed necessary annual funding for maintenance of quality, general O&M, and the building up of a sinking fund is not fully provided, medium and long term sustainability of the improved performance would be in serious doubt
- Using the SD model as a LBM during and post IDA will be very important, as will be modifying the SD model as necessary so that it reflects reality (Sec 9.7 refers).
Risk Mitigation and additions to improvement strategy
The following needs to be included in the improvement strategy of Sec 9.4.6 to mitigate risk:-
- With IDA – use the SD model as a LBM as part of active and close M&E and subsequent management action
- Post IDA - use the SD model as a LBM as part of active and close M&E and subsequent management action
9.4.8 Gantt Chart– 1st Pass
Fig 9.12 is an indicative Gantt (not to scale) of main events based on PIP#5 and the improvements strategy. It is indicative only as refinements will be necessary in a 2nd pass. Sec 9.6 discusses a 2nd pass.
Fig 9.12
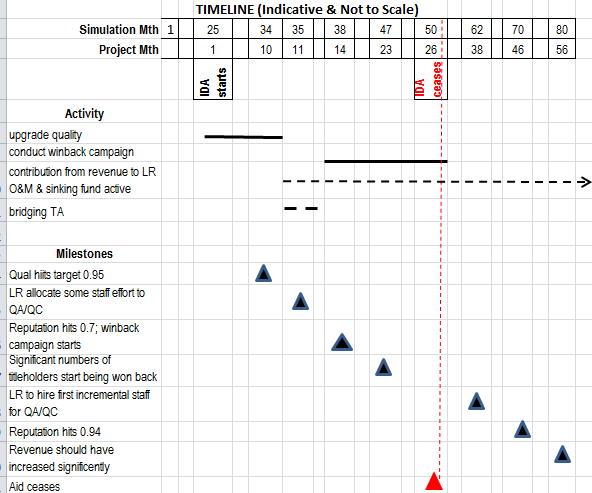
Comments on Fig 9.12
- This is indicative and based on a quick 1st pass. It indicates a number of things that need to be addressed in the 2nd pass. e.g.:-
- The timings and duration of a quality upgrade and winback campaign, the value of reputation to be reached before winback is started, and the need for bridging TA if there is gap between these two activities so that continuity and momentum is not lost
- When the Treasury Department is likely to approve the use of some revenue to achieve adequate O&M, the commencement of the sinking fund, and when funds will actually commence flowing.
- Above will undoubtedly also change during implementation as a result of M&E
9.5 Project Financials, Sustainability and Evaluation – 1st Pass
This is step 7 in the SD approach.
Chapter 6 provided the detail of how project costs and revenues and evaluation was carried out for the backlog example. This will be largely followed here. An advantage of working with an integrated model is that if an input, duration or unit cost is changed, the model immediately recomputes revised costs/revenues.
This is a hypothetical illustrative example. point The important is not the numbers, but how financials are an integral part of the SD model. The purpose of a 1st pass is to get a quick estimate of the quantum of costs, revenues, financial benefit from the proposed improvement strategy, and an idea of how attractive such an improvement project might be to an aid donor.
9.5.1 Costs
It is necessary to distinguish between the once off costs of the project and the recurring annual O&M (operation and maintenance) costs.
9.5.1.1 Project Costs (once off)
Total project costs have been estimated at local $9.01m (~US$1.8m) over two years with ~70% occurring in project year 1. It has been assumed that IDA will provide the entire once off project funding.
Project costs cover items such as:-TA (technical assistance both national and international); local temporary staff, establishment procurement; operating costs.
9.5.1.2 Annual & recurring O&M costs– without and with project
The provision of funds for annual recurring O&M costs is the responsibility of the IC land agency. In the setting of this example (Sec 9.1) it was noted that currently the budget provided is barely sufficient for salaries and there is insufficient for training, technology maintenance, upgrading and replacement. The current adequacy of the O&M allocation was estimated at 0.5 (out of 1). Fig 9.1 refers.
O&M costs without the project (i.e. current situation)
The current annual budget for O&M was determined by the model to be local $883,200/yr ($73.6k/mth) and this agreed with IC finance records.
This cost covered salaries plus 15% of salaries for consumables, maintenance and similar.
O&M costswiththe project and post project (to achieve an adequate O&M budget)
An adequate annual recurring O&M budget to assist sustainability was calculated by the model to be local $1,004,000/year ($83.7/mth).
Extra O&M funding required to achieve an adequate O&M budget (a PIO)
Extra funding required is local $120.8k/yr ($10.1k/mth); a 14% increase.
What the extra funding covers - The improvement strategy (Sec 9.4.6) included increasing the O&M allocation. The design team considered that the increase was to:-
Adequately maintain:-
- the LRs technology held prior to IDA supplementation (est ~local $100k)
- the technology funded by IDA and used to achieve the improvement in quality of the LR (est ~local $250k)
- the skill levels of LR personnel
Cover the cost of:-
- The incremental hiring of additional LR staff to ensure quality is maintained and processing capacity meets demand
- Annual maintenance and consumables costs (order of 15%/yr of total technology cost)
- Establishing a sinking fund (SF) to fund recurring medium term replacement of technology etc (~10 yrs for life of technology)
- LR salaries supplementation to an adequate living standard (increase of 10% - to reduce the need for informal fees)
9.5.2 Revenue – without and with the project
Chapter 6 Sec 6.5 showed the method used for calculating revenues with and without the project. The same general approach will be followed for this example. The same types of LR fees are charged as in Sec 6.5.1 (viz application fee on lodgement and stamp duty just before finalisation.
NB
- Since this is a 1st pass, the estimate of annual revenue had been taken from the ~average value of annual revenue at year 10, half way through the period of 20 years used for the B/C (Benefit to Cost) calculation. In a 2nd pass the estimated revenue for each year can be calculated and the time cost of money taken into account in a full CBA (cost benefit analysis).
- Available data on revenue collected is sketchy so model estimates should be treated with caution.
- The significant increase in revenue is mainly due to the assumptions made re (a) the success of winning back customers, and (b) the rate at which these won back customers will lodge applications with the LR. Again revenue estimates should be treated with caution.
Revenue without the project
- The revenue without the project is estimated from the model to average ~local $1.80m/yr ($150.0k/mth)
- The ratio Revenue to O&M costs is ~2.0
Gross Revenue with the project
- The gross revenue with the project is estimated from the model to average ~local $2.64m/yr ($220.0k/mth). Revenue is gross as it does not take into account the reduction in revenue due to funding the extra O&M costs and annual contributions to the SF.
- The ratio Goss Revenue to O&M costs (with the project) is ~2.6.
Extra Gross revenue due to project,
Extragross revenue due to the project is ~local $840k/yr ($70k/mth); [~$8.4m over 10yrs or ~$16.8m over 20 years.
Extra net revenue after extra for O&M & SF allowed for
Extranet revenue (after reducing gross for extra O&M costs) due to the project is ~~local $719k/yr ($59.9/mth); {~$7.2m over 10yrs or ~$14.4m over 20 yrs,}.
9.5.3 Financials at a glance
The following two sets of figures and one table give financials at a glance. Comments are provided after each.
Fig 9.13 shows revenue collected and revenue missed, with and without the project. NB. Figs have been sized to get the vertical scale to approximate.
Fig 9.13a with the project Fig 9.13b without the project
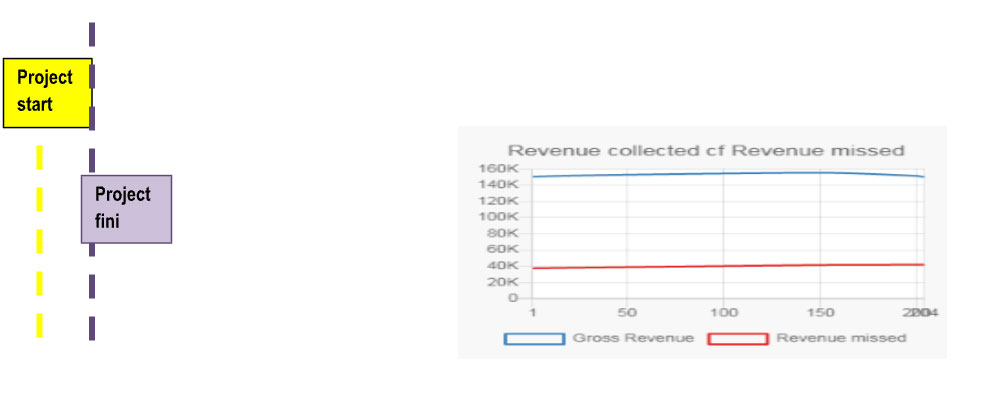
Comments on Fig 9.13
- Fig 9.13a shows the time flow of revenue collected and missed per month with and without the project.
- The project causes a significant increase in revenue and a corresponding decrease in revenue missed. This was one of the PIOs.
- Fig 9.13a shows that revenue collected continues to increase steeply for some time after the project and IDA finishes. This is due to reputation lagging quality and not reaching its target value for some months after project completion and also that attracting back titleholders takes time even after reputation has reached its target value.
- There is ~47%.increase in gross revenue per mth with the project and this is due to:-
- having won back ~75% of those titleholders who were not previously using the LR, and importantly retained them, due to the increased reputation of the LR, and if those won back submitted applications to the LR at the same rate as those currently using the LR.
- the backlog being kept low from increased productivity, due to the increase in quality;
- some small increase in transactions and property values due to the much higher reputation of the LR.
- Included in the above is an automatic incremental increase in staff to ensure that the backlog is kept low and some effort goes into maintaining quality
Fig 9.14 shows some financials with and without and the project. NB. Figs have been sized to get the vertical scale to approximate.
Fig 9.14a with the project Fig 9.14b without the project
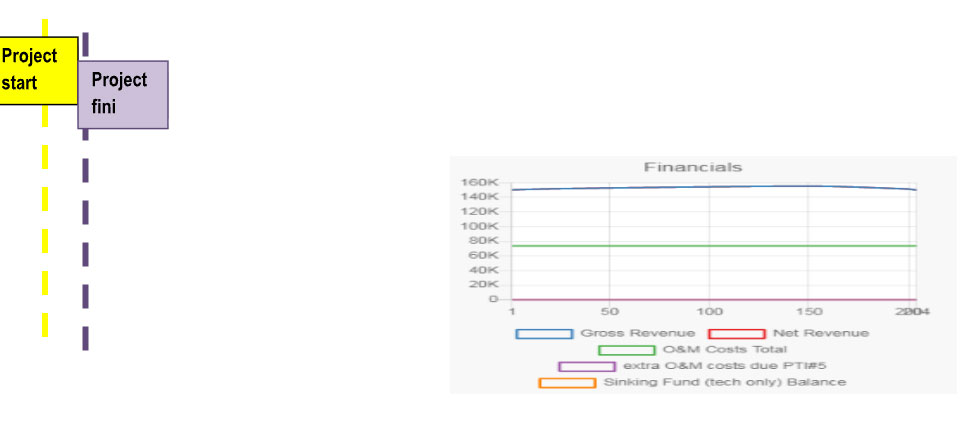
Comments on Fig 9.14
- In Fig 9.14a gross revenue is shown by the top blue line and net revenue by the second top red line. Net revenue is gross revenue less the extra O&M costs shown by the bottom blue line. The effect of the extra O&M costs is relatively minor.
- In Fig 9.14a Total O&M costs (LR O&M before the project + extra O&M costs) are shown by the green line. While Total O&M costs are significant, they are much less than revenue, especially when the full impact of the project kicks in.
- In Fig 9.14a the orange line shows the monthly balance of the sinking fund (SF) which was established to fund technology replacement. . At ~ mth 148 the balance drops considerably due to a major technology upgrade and then slowly rises again.
- Technology maintenance and replacement tend to be expensive as it is often priced in US$ or equivalent. Sustainability of improvement is essential if quality and reputation is to be maintained at the high levels achieved due to the IDA project. Hence the need for a SF. If quality is not maintained it will decay, leading over time, back to the situation before the IDA project.
- Retaining a small amount of revenue to ensure sustainability will require approval of the IC Finance Department. Part of the case for this would be the financials and modelling provided in this example and to consider the LR as a very young golden goose that, if properly fed and looked after, will lay golden eggs (increasing revenue for the government) indefinitely into the future, as happens in LRs in developed countries.
- Fig 9.14b shows revenue collected (top blue line) and total O&M costs without the project. Goss and net revenue are the same without the project as there are no extra O&M costs, and no SF.
Table 9.6 provides a summary of financial data for without and with the project
Table 9.6
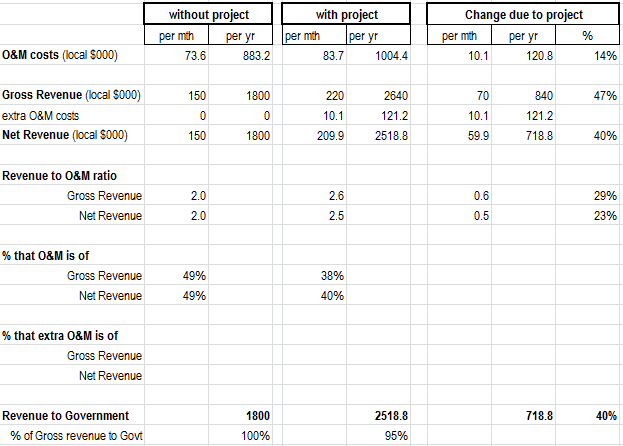
Comments on Table 9.6
- This table provides some additional data. Relevant comments have been made in the comments for Figures 9.13 and 9.14.
- The project would provide in the order of an extra local $719k/yr to the government. Funding the extra O&M costs from using a small amount from the gross revenue would still provide the government with 95% of the gross revenue, and an extra $719k/yr in revenue.
- The NBs at the end of the introduction to 9.5.2, Revenue -without and with the project, need to be noted
9.5.4 Project Evaluation – 1st pass
Chap 6 Sec 6.6 provided the framework and the reasoning used for the example of removing the backlog and keeping it low. That framework is followed here.
9.5.4.1 Project evaluation - financial
Sec 6.6.1 provided the framework for this section. As this is a 1st pass only the two ratios below have been used. Fig 9.13a showed the increase in revenue due to the project.
Extra Revenue to Government
The project would provide in the order of an extra local $719k/yr to the government. Funding the extra O&M costs from using a small amount from the gross revenue would still provide the government with 95% of the gross revenue.
Ratio Benefit to Cost
The B/C (Benefit to Cost ratio) is ~1.6 (taking a 20 year period and ignoring discounted cash flows to get an idea of order of magnitude in this 1st pass).
Ratio Annual revenue collected to annual recurrent O&M costs
Without the project - the ratio Revenue to O&M costs is ~2.0
With the project
- The ratio Goss Revenue to O&M costs is ~2.6.
- The ratio Net Revenue to O&M costs is ~2.5.
NB
- This example is for a small district LR which has about 100,000 titleholders but about 20,000 at the beginning of the project do not put their land dealings through the LR. During the project about 15,000 are estimated to be won back. This accounts for the increased revenue, together with the sustained increase in quality and reputation of the LR, giving titleholders more confidence in dealing with the LR and increasing their application lodged.
- The example’s story line (Sec 9.1.1) indicated that it could be treated as a pilot and, if sustainable, scaled up and rolled out to the numerous LRs in other districts.
- The combined financial results from successfully scaling up this pilot would be significant. However, successfully scaling up is not without challenges. It would be necessary to build organisational capability and capacity to undertake a large scale up and roll out. An example of applying the SD approach to scaling up is shown in a later chapter.
Conclusion – project evaluation- financial
The project’s financials indicators are adequate on this 1st pass and these provide good reasons for considering the project. Sec 9.6 lists matters that could be addressed in the 2nd pass.
9.5.4.2 Project Evaluation – Non direct financial considerations
Sec 6.6.3 provided the framework for this section. Some considerations follow for this example.
Titleholders should be much happier with the LRs improved quality and reputation and short processing waiting times. This happiness should ensure few slip back to be titleholders who do not use the LR. Tenure security of titleholders should increase.
The community (including businesses) should hold much higher levels of confidence in the LR, and be more willing to do business with it.
World Bank rankings for transferring a property should rise and so should the rankings for the ease of doing business. If these rankings can be maintained it indicates that improvements can be sustained post IDA, and that more IDA would likely be fruitful.
IDA providers are likely to view sustained improvement post IDA as an indicator that more IDA could be provided to conduct a large scale up for improving quality and winning back titleholders in a large number of other LRs. Also, there may be a willingness to support a pilot at the same site the for initial recording of property rights, and/or an inventory of government land and then the establishment of a land lease rent system for government land. Fig 2.2 in Chapter showed the schema for the various LA operational entities.
Formal lenders (incountry banks) may be more willing to consider lending using a title to property as collateral where the high quality of a title can be shown. This is examined in two later chapters.
Conclusion – project evaluation -Non direct financial considerations
There are good non direct financial reasons for considering the project
9.5.4.3 Is Project worth investment consideration?
Sec 6.7.1 provided the framework for this section. There are several perspectives, as indicated below, for this example.
The host country and its land agency
- Where the project’s costs are provided as a grant - If project costs are provided as a grant by a bilateral donor this should be very attractive to a host country due to the financial and non-financial benefits. Also, the achievement of sustainable benefits should lead donors to consider more IDA in LA.
- Where project costs are a loan that has to be repaid – The 1st pass at the financials indicate that a loan could be repaid. This would need to be confirmed by 2nd pass at the financials after fine tuning the improvement strategy and doing a number of What ifs for assumptions re rates of winback, and rates of submitting applications.
The aid donor in a developed country providing the project costs as a grant
If the aid donor had provided the IDA for the example in Chapter 4-7, successfully removing the processing backlog and keeping it low post IDA then, (assuming the 2nd pass of fine tuning the improvement strategy and financials were still favourable), there should be reasonable confidence in investing. Also, if this project is also sustainable post IDA, there are potentially other aspects of LA improvement that could be supported.
A development bank providing the project costs as a loan
This is a small $ project based on a small district LR and the once off project costs over ~1.5 years is ~US$2m. Development banks may consider the amount too small over too short a time unless it was to be a pilot for a scale up to many LRs in the country.
Conclusion –the project is worth serious investment consideration, especially as a pilot, for a much larger roll out to many other district land offices. Its use as a pilot would allow much actual data to be collected and allow the development of a refined model which could then be used more effectively to plan the rollout. A 2nd pass is warranted.
NB– an important point
- It is not the results from this particular example,
- It is the application of the SD approach; which is logical, quantitative, transparent, no hidden assumptions, easily modified and the valuable insights it provides.
How the SD approach adds value was shown in Chapter 8.
9.6 What could be done in the 2nd Pass: A time to do rather than more planning
What the 1st pass provided
The relatively quick 1st pass, conducted IC by a joint design team provided:-
- an improvement strategy to achieve the PIOs effectively and with sustainability post IDA
- a positive project evaluation (financial and non financial) indicated project was worth investment consideration
Main aspects that could be considered during a 2nd Pass
During a quick 1st pass many aspects that require more detailed consideration are identified. The main ones in this example are:-
- Re PIP#1, upgrading the LR. The rate at which the upgrading is anticipated to be achieved. Should more time be allowed, at a less intense rate, to allow better absorption? Are more resources (& higher project costs) necessary for data cleansing and validation?
- Re PIP#4, the Winback campaign. How the winback campaign is to be conducted as it has not been done before; the rate at which titleholders not using the LR are anticipated to be won back, and how this will be measured or estimated; the resources and durations (& costs) necessary for the winback campaign; will a longer period be necessary?
- When to start the winback campaign. How long is the lag likely to be before much higher quality is reflected in higher reputation held by customers/ community? What is an appropriate value of reputation to be reached before commencing the winback campaign? There may be a time gap between the completion of the quality upgrade and the start of the winback campaign, how might this be best addressed?
- Refine that part of PIP#5 which deals with using a % of the increased revenue to achieve adequate O&M budgets and sustainability post IDA. Seek to obtain Treasury Department approval and a start date.
- Identification of any additional PIPs to be included
- Knowledge of structure and quantum of revenue collected. Little is known about the detail of revenue collected, and its basis. Should this be addressed in the 2nd pass or would it be better done as part of project implementation?
- The structure of the graphical functions for “effect of … on…” in the feedback loops. The structure and values assigned can have a significant impact on model trajectories for PIOs/KPI/PIs, therefore conducting What Ifs and sensitivity runs would be prudent.
- Refining costing data and assumptions
- Modifications and extensions to the SD model and a rerun of testing the PIPs, conducting What Ifs and sensitivity tests, and modifying the improvement strategy as necessary
- A full project evaluation. A full financial analysis to include annual revenue over the 20 years including the time cost of money. A review of the non direct financial benefits and an update of “is the project worthy of investment consideration”.
There comes a time to start doing rather than more fine tuning of a plan
As indicated in the example’s story line and in subsections above, there is a lack of reliable historical data in many areas. This is not unexpected.
The SD model is only a model which has been used to test improvement proposals for effectiveness and sustainability. The model is considered useful in that it develops a view of what the system is, how it operates, and how it can be improved.
Caution needs to be exercised in taking the refining of the 2nd pass too far and invoking the law of diminishing returns. There comes a time to implement, and learn by doing, drawing upon the insights obtained from the model, and using the model as a LBM (living business model) to assist managers to manage the implementation of the improvement process.
The Importance of M&E during implementation and post IDA
The story line indicates the lack of reliable historical data, and the aspects to be considered in the 2nd pass also indicate this. Therefore much will be learnt during M&E (monitoring and evaluation) by recording, tracking KPIs/PIs (performance indicators) and comparing actual performance results, to trajectories from the model.
As learning by doing progress, it will probably be necessary to modify the SD model so that it reflects actual conditions on the ground. An example of this is provided in the next section.
9.7– Using the SD model as a LBM (living business model) for M&E
This is step 8 of the SD approach. The framework was explained and illustrated in Chapter 7 for the first example of removing a backlog, and is followed here.
This section assumes that approval was given to implement the project and that implementation is underway.
9.7.1 KPI/PIs to be monitored
The PIOs (Sec 9.1.3) are KPIs, and PIs were identified in Sec 9.2.3. The PIOs/PIs used to test the PIPs were listed in Table 9.3. Chapter 7 showed using the model as a LBM for the backlog example in some detail. Fig 7.1 showed how, using the dependency trace feature of the Sysdea software, a PIO (backlog in that case) could be selected and the causal chain to the PIO identified, together with a chain that is dependent on the PIO identified. From this, KPIs and PIs were identified in Table 7.1 for the backlog example for M&E.
The core of the backlog model is incorporated into the SD model for this example. Using the same logic KPIs/PIs can be identified. It is also necessary to consider what items can be reasonably easily counted as part of the normal work flow. It is important not to make what might be viewed as unnecessary work, as this can affect the sustainability of M&E, post IDA.
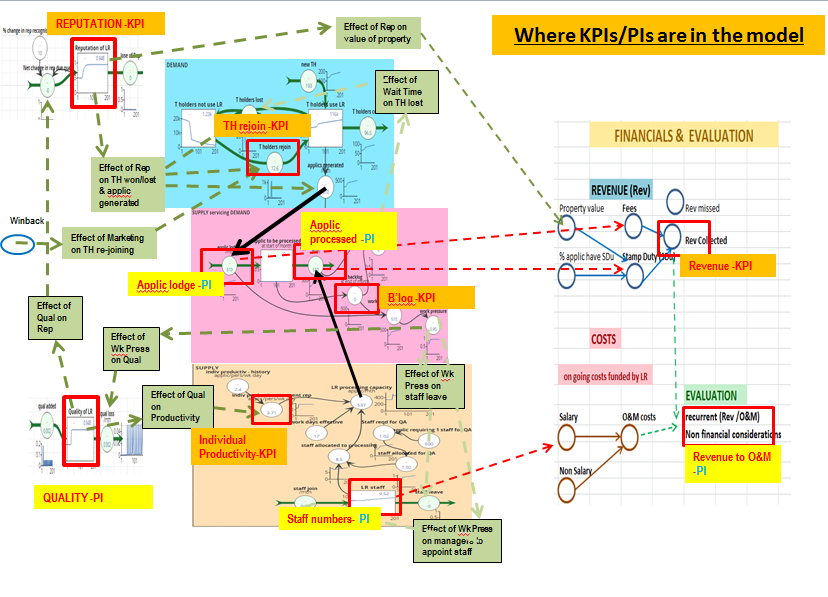
Fig 9.15 shows the KPIs/PIs selected for M&E positioned in an image of the model.
Fig 9.15
The steps in using the SD model as a living business model
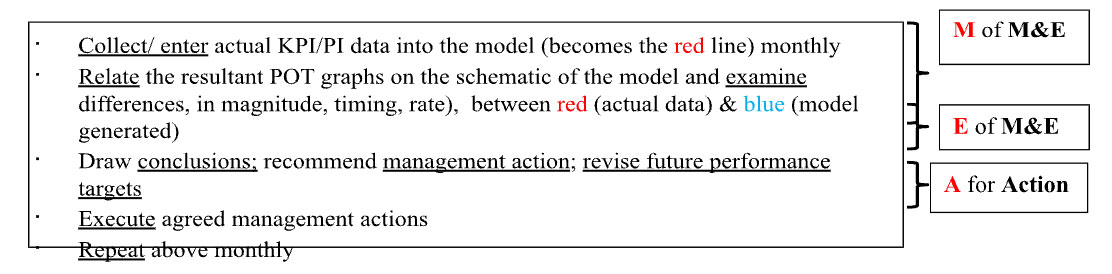
The next subsections show the application of the above.
9.7.2 Performance Status – at 3 mths before end of IDA
3 months before the end of IDA is 13 months after end of the quality upgrade, 9 months into the 12 months of the winback campaign, and is month 47 of the simulation. The months of the simulation are the horizontal time scale of Fig 9.16 which shows POT graphs of actual results (red) compared to target (blue) for some KPIs/PIs, with traffic lights indicating degree of attention required, imposed on an image of part of the model. It was decided that some PIs could be included later once M&E/LBM use is firmly operational in the LR. Estimating titleholders won back is difficult, but effort to do this is required to gauge the success or otherwise of the winback campaign.
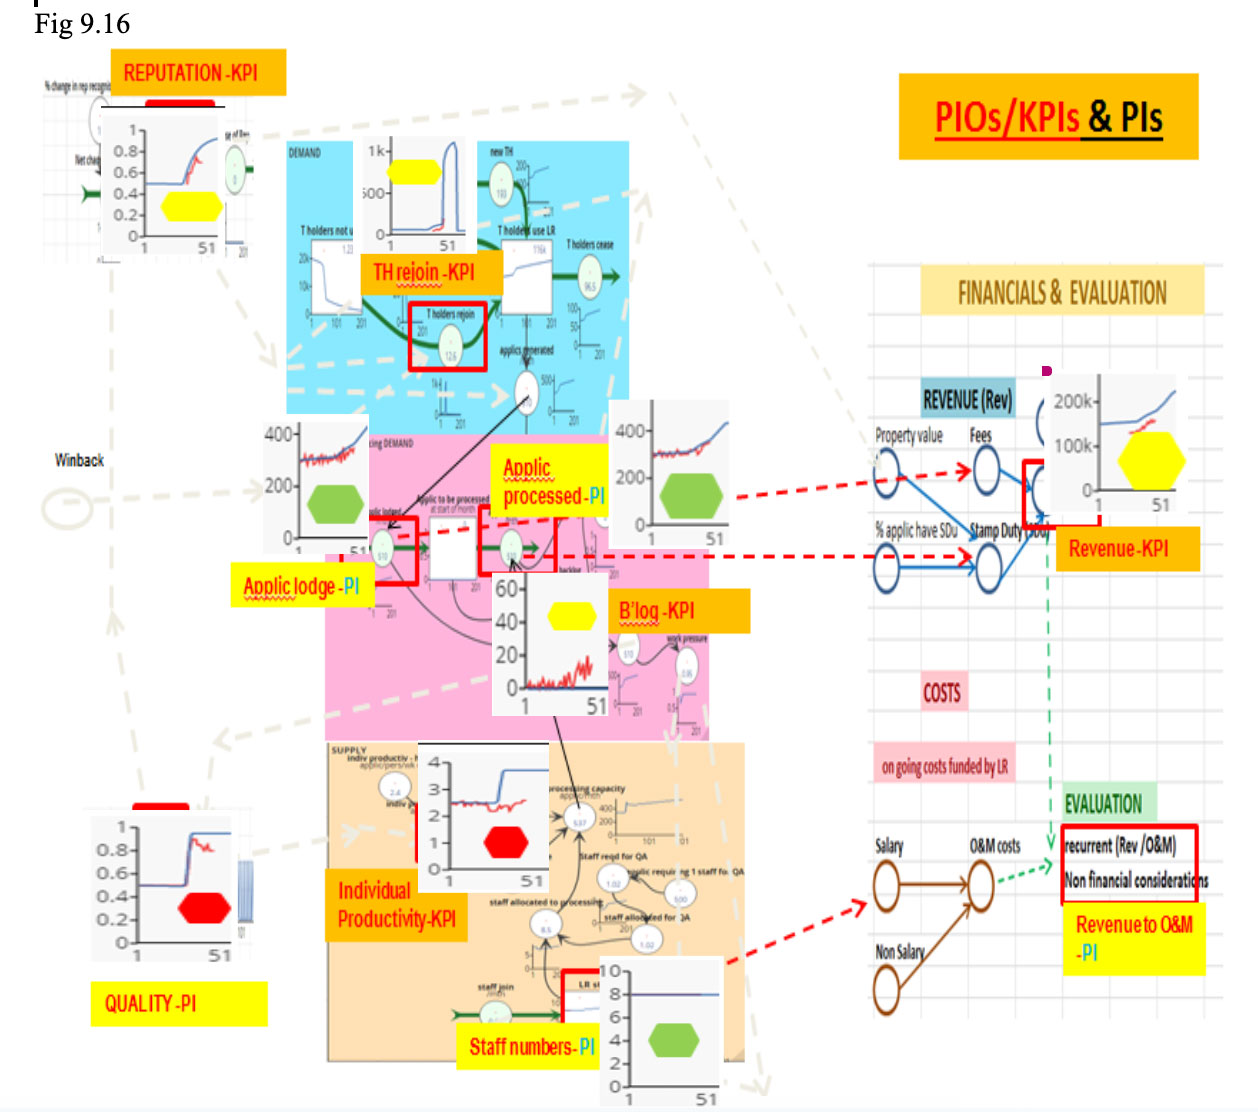
The four yellow and two red traffic lights indicate that close management attention is needed. Table 9.5 shows the conclusions drawn and actions recommended to LR management
Table 9.5
| Conclusions | Recommended Management Action |
|---|---|
|
|
|
Monitor closely in the following months. |
|
|
|
|
|
|
|
|
Overall comment - Quality and individual productivity have decreased since the end of IDA for upgrading. It could be that these will start to increase after staff have more training and experience with the upgrading. This needs close monitoring.
9.7.3 Performance Status – at 7 months after the end of IDA
7 mths after the end of IDA is 23mths after end of quality upgrade and 8 mths after the end of winback campaign and is month 57 of the simulation. Simulation months are shown on the horizontal scale of Fig 9.17. This shows POT graphs of actual results (red) compared to target (blue) for some KPIs/PIs with traffic lights indicating degree of attention required, imposed on an image of part of the model.
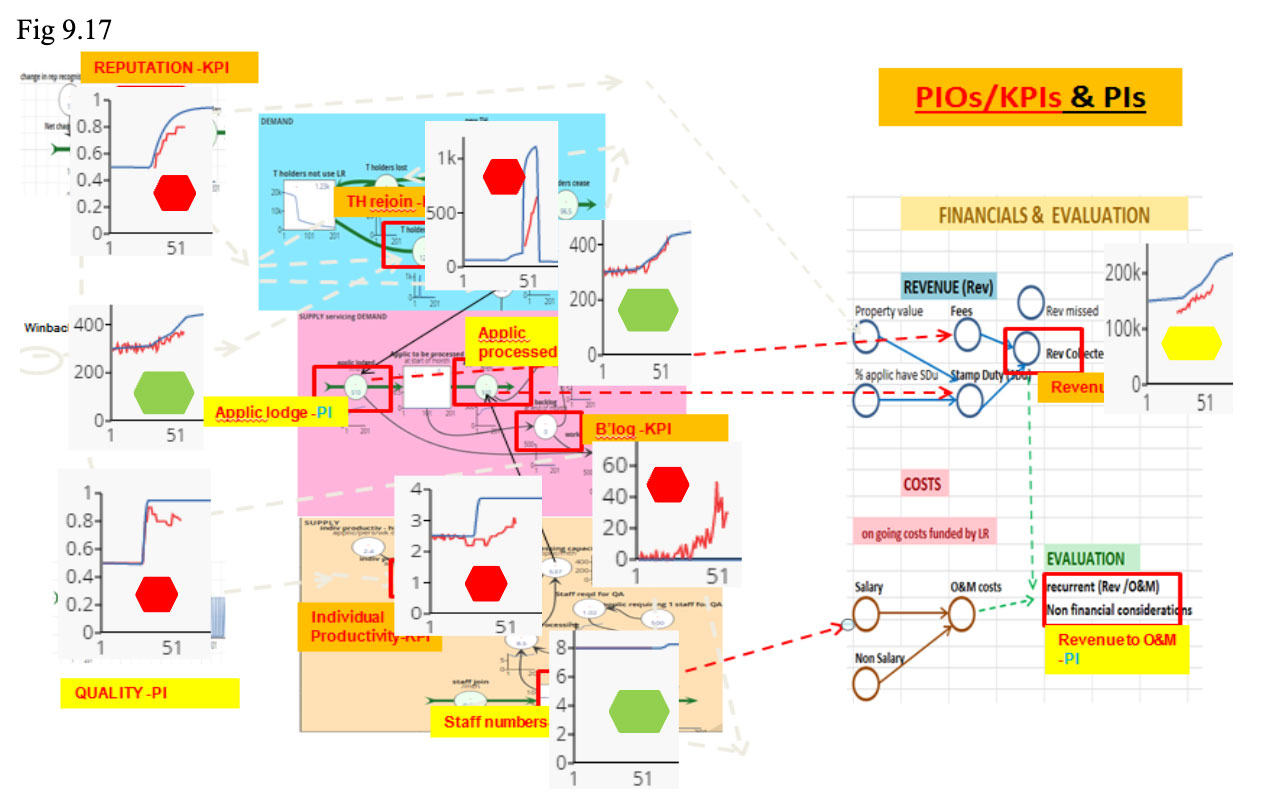
The five red traffic lights indicate a serious situation. Table 9.6 shows conclusions drawn and recommended actions to LR management.
Table 9.6
| Conclusions | Recommended Management Action |
|---|---|
|
Consider asking the aid partner for another 12 months of support to get quality to the target value. |
|
|
|
Check actual results compared with target at the next review period, and again after reviewing the effectiveness of the win-back campaign, to see what trend is emerging. |
|
|
|
|
|
|
|
|
| The SD model was appropriate to this stage, but the model needs to be refined to take into account various types of applications and different fees, and to better reflect past Performance over Time. |
|
Overall comment– Above indicates some serious challenges. Quality, individual productivity and revenue have not increased to target levels as hoped. There is uncertainty about the effectiveness of the winback campaign. Actions for management have been recommended. One recommendation concerns determining revised performance targets. These could be considered What Ifs for management to consider. Revised performance targets are determined in the next sub section.
9.7.4 Setting revised performance target for quality and calculating revised targets for dependant PIs
The mechanics of setting revised future performance targets for one or two key performance entities in the SD model, and then calculating revised dependant future targets, was outlined in Chapter 7 Sec 7.2.3 and is followed here.
Two cases are examined:-
- Quality stays at 0.8
- Quality stays at 0.8 for another 12 months and then increases to 0.95, in the hope that additional aid will be provided to assist the LR to further increase quality to target value again and sustain it there.
Case 1 - Quality stays at 0.8 - the revised dependent future performance targets are shown in Fig 9.18
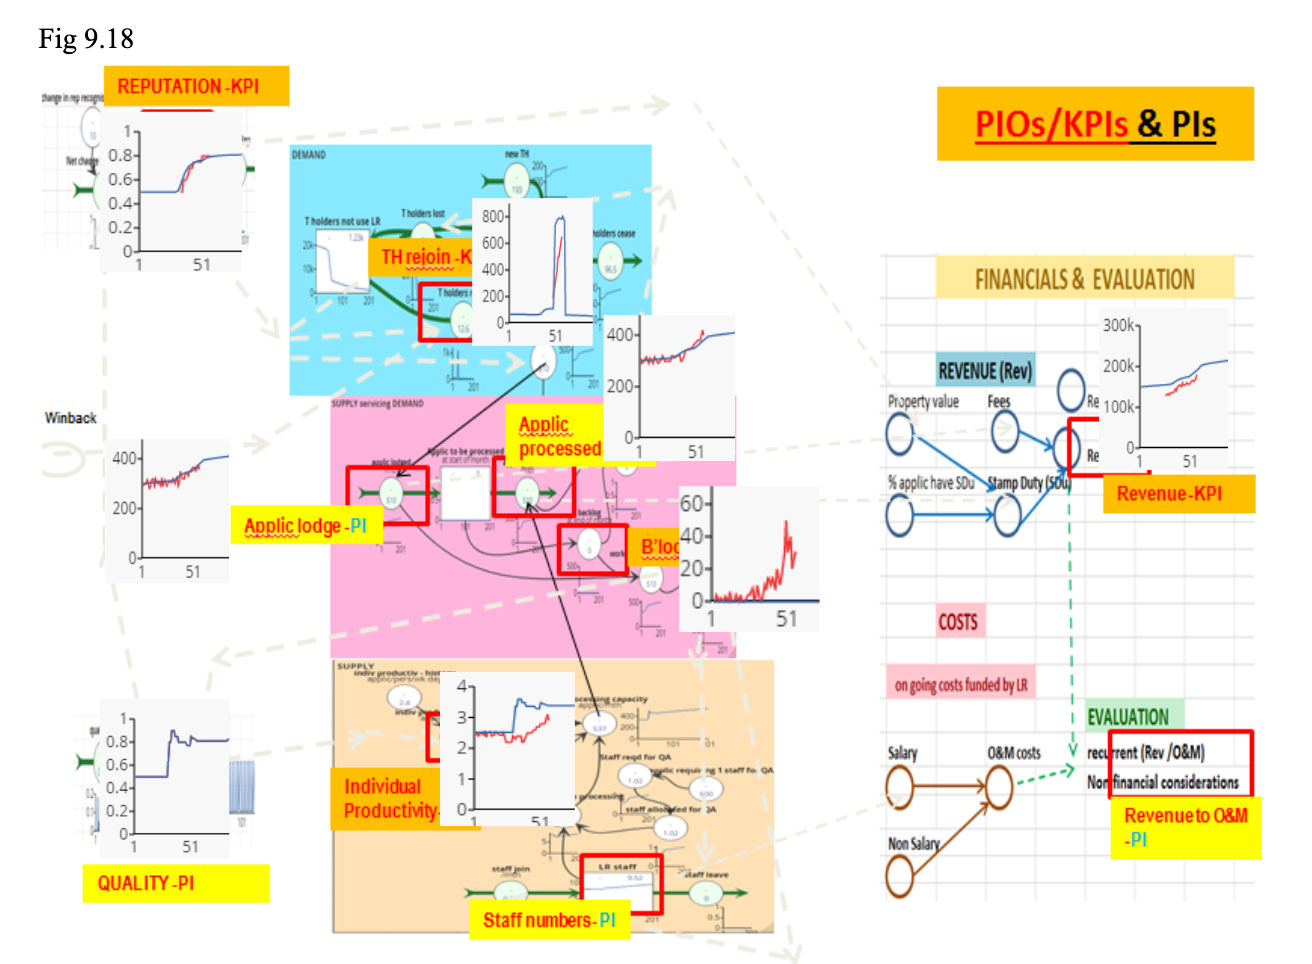
Comments on Fig 9.18
- The model (blue lines) now aligns much better with the actual data (red lines) for past performance of quality, reputation, applications lodged and applications processed.
- TH rejoin (Titleholders who rejoin) magnitude is closer to the revised target but lags – the winback campaign needs reviewing
- Indiv productive (individual productivity) has been seriously missing its target but seems to be heading towards it. This could be due to a delay in LR staff becoming competent with the upgrade. This needs close tracking for the next three months
- Revenue is increasing but is tracking below target. The recommendations re revenue in Table 9.6 need to be carried out.
- The revised targets are all below the targets aimed for at design.
Case 2 - Quality stays at 0.8 for another 12 months and then increases to 0.95 as more aid has been provided to assist the LR to further increase quality
The revised future performance targets are shown in Fig 9.19.
Fig 9.19
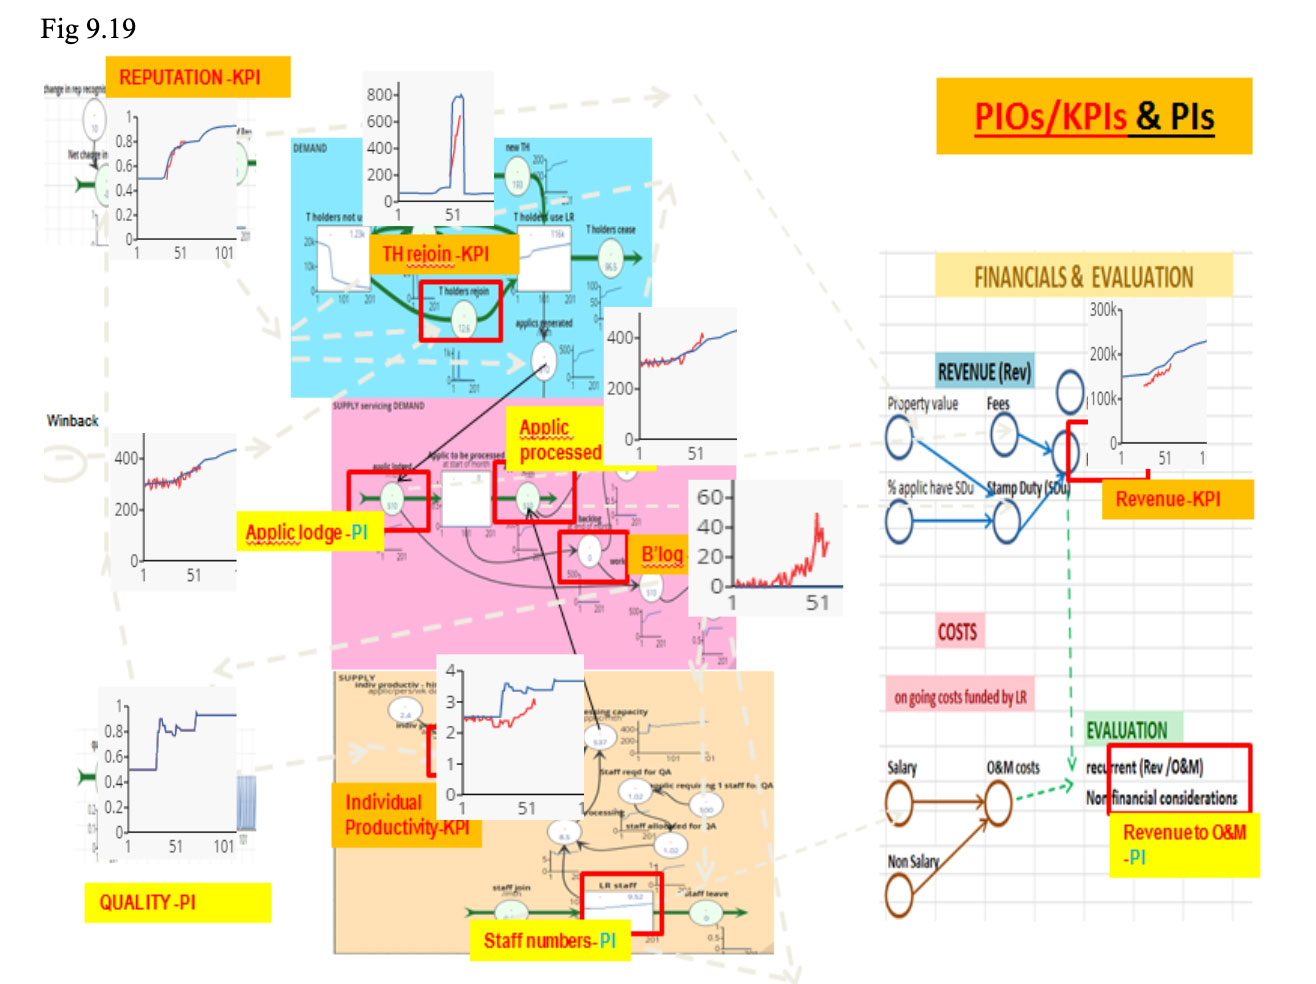
Comments on Fig 9.19
- Assuming quality reaches and maintains its original target value, then reputation and individual productivity should reach their target values, albeit much later than anticipated at design and mid-way through implementation.
- It is very important to carry out the full examination of revenue as recommended to management in Table 9.6 and to understand this revenue stream in detail so that more reliable forward estimates can be made. Without this revenue stream significantly increasing, it may not be possible to gain sufficient additional recurrent funds for adequate O&M. This would put sustainability in danger.
- It is also important to carry out the recommended review into the effectiveness of the winback campaign to ascertain if changes are needed and further effort required. The increase in revenue is dependent on winning back and keeping a significant percent of titleholders who do not use the LR
- Additional IDA will be necessary to achieve the increase in quality from the current 0.8 to the target of 0.9, and to sustain it, and to modify and extend the winback campaign.
Important points re M&E and using the design model as a LBM (living business model)
- The SD model is not restricted to design; it is also an important tool in managing the project.
- The SD model assists in managing the project by being able to test potential improvement strategies by setting revised performance targets for selected KPIs and then determining their effects on causally dependant PIs
- M (monitoring) & E (evaluation) needs A (action) by management to be effective.
9.8 The importance of determining an appropriate aim (PIOs)
The importance of clarity of the aim
In this example five PIOs (performance improvement objectives) were identified from the story line (Sec 9.1). Once the PIOs weredetermined all else followed. i.e., the sketching of POTs for each PIO; determining the scope/boundary of the system to be improved; the PIPs and their indicative inputs and durations; the SCS; the building of the SD model and the testing of each PIP; the identification of an improvement strategy; estimation of project financials and non financials, and an evaluation of the project for investment. The model showed the logic chain clearly, transparently and quantitatively, based on the PIOs/the aim.
If the selection of the PIOs is not appropriate, then the improvement strategy will not deliver the hoped for development results. It is therefore vital that the aim of a project is be given sufficient thought.
One can debate the appropriate terminology to use; e.g., aim, objective or goal. For the purpose of discussion here, it is simply what is wanted to be achieved. It is not uncommon in IDA projects for goals/outcomes to refer to what is hoped to be the state some years after an IDA project has finished, and for outputs to refer to deliverables achieved as a result of the IDA project and during its life. Chapter 3 provided a discussion of development logic and indicated where a system fits into the development logic, and how such an inclusion influenced results. Sec 8.3 of Chapter 8 also had some discussion.
The thrust of the SD approach is on improving performance. The PIOs and their POTs of past and desired future performance provide the what is wanted to be achieved and constitute the aim. The focus in design is on the achievement of the desired end state. The focus during implementation with IDA and then post IDA is on the management of the improvement undertaking to achieve the aim. While the tactics of how to achieve the aim might be modified, the strategic objective, the aim, does not change. Thus the focus is on sustainability once IDA finishes. One could argue that an important design principle is to design to achieve affordable sustainability of improvements post IDA
How this example would have been different with different PIOs (aim)
This example had five PIOs. If there had only been only one PIO (aim), to upgrade the LR as a once off activity, then the resultant POT, model, improvement strategy, and anticipated end state would have been quite different. e.g. few titleholders won back; little increased revenue; no increase in O&M and the increase in quality not sustained.
An internally focused supply provider might well argue for the one PIO (aim) of upgrading. A broader development focus would lead to a different aim, such as the five PIOs of this example.
The importance of the model reflecting the design approach – ie model is fit for purpose
The design approach called for a quick 1st pass to test the PIPs, determine an improvement strategy, and carry out a project evaluation. This required that the model for this 1st pass was fit for that purpose, and the Agile SD approach of Warren was followed. The 1st pass in this example determined that an improvement project was worth investment consideration. The 2nd pass to refine would probably require some modifications to the model.
9.9 What has been shown in this chapter
This chapter has shown:-
- How a quick 1st pass for design, using the SD approach, can provide-
- an improvement strategy to achieve the PIOs effectively and with sustainability post IDA
- a project evaluation (financial and non financial)
- How, in managing the improvement process, the SD model can be used as a LBM (living business model)
- How multiple PIOs and intangibles can be handled
- The importance of giving sufficient thought to the aim /PIOs
NB
Neither this example nor the results obtained are the most important aspect.
The important aspect is how the SD approach can be used to address an improvement effort . If one does not agree with the logic and structure of the SCS or the structure of the SD model, then it is relatively simple to develop an alternative SCS and SD model and use them. The most important point is that the SD approach is logical, quantitative and transparent, with no implicit assumptions or hidden hard wiring. How the SD approach adds value was shown in Chapter 8.
9.10 Key Points
11.0 Key Points
- This example showed how the SD approach can be used:
- In design to quickly do a 1st pass to test PIPs, to determine an improvement strategy to achieve multiple objectives, including intangibles such as quality and reputation, and to conduct a project evaluation
- In management / implementation to use the SD model as a living business model (for M&E) to manage the strategy and fix problems when they occur.
- This particular example showed:
- the importance that quality (of products/services) and reputation (as perceived by customers/community) and the effect they have (via feedback loops) on the performance of the operational system
- the necessity to maintain high quality post IDA, via adequate annual O&M funding from using a small % of the increased revenue generated by achieving and maintaining the PIOs
- IC management of the LR can, post IDA, use the model as a LBM to manage and fix problems as they occur
- Where past POT data and operational information is scarce, the law of diminishing returns can apply to fine tuning designs, and there comes a time to learn by doing.
- An important point
- Is not this example nor the results obtained, but
- Is the application of the SD approach to improving performance (in an aspect of development in LA). [The SD approach is logical, quantitative and transparent, with no implicit assumptions or hidden hard wiring. If one does not agree with logic and structure of the SCS, The PIPs or the structure of the model, then it is relatively simple to develop alternatives and use them.]
- It is vital that what the aim /PIOs is, both with aid and post aid, be given sufficient thought. Once the PIOs are determined all else follows. e.g., the system to be improved, the SCS, the model, the improvement strategy. If the selection of the PIOs /aim is not appropriate, then the improvement strategy will not deliver the hoped for development results.
- By collaboratively developing a SCS (using paper and coloured pens), early in the design process in country, it is possible for a joint design team to get an early understanding of the dynamics in play, and qualitatively what the various PIPs might achieve, as well as what the elements of a suitable improvement strategy might be. As well as developing joint understanding, this assists buy in. However what is very important is that a SD model is required for quantitative results.
- The story line of this example of the upgrading of small LR of ~100,000 titleholders indicated that, if successful and sustainable, it could act as a pilot for the rollout of improvements to many other district/regional LRs. From the pilot, actual data on flow rates and operational parameters could be obtained and used in a revised model for further upgrades. As more LR upgrades are completed.
References
Burns et al (2018) Framework for Costing and Financing Land Administration Services (CoFLAS), United Nations Human Settlements Programme (UN-Habitat), https://gltn.net/download/framework-for-costing-and-financing-land-administration-services-coflas/
Warren (2014), Agile SD: Fast, Effective, Reliable, Strategy Dynamics Ltd; Presentation to International
System Dynamics Society, Delft July 2014 https://www.youtube.com/watch?v=GKEBIIgVA1Q
Warren K (2018), Agile system dynamics (Agile SD) for fast, effective, reliable dynamic business models, Strategy Dynamics Ltd
Warren (2019), Extension modelling course, Strategy Dynamics Ltd.
Annex A
The WHY WHY WHY DIAGRAM
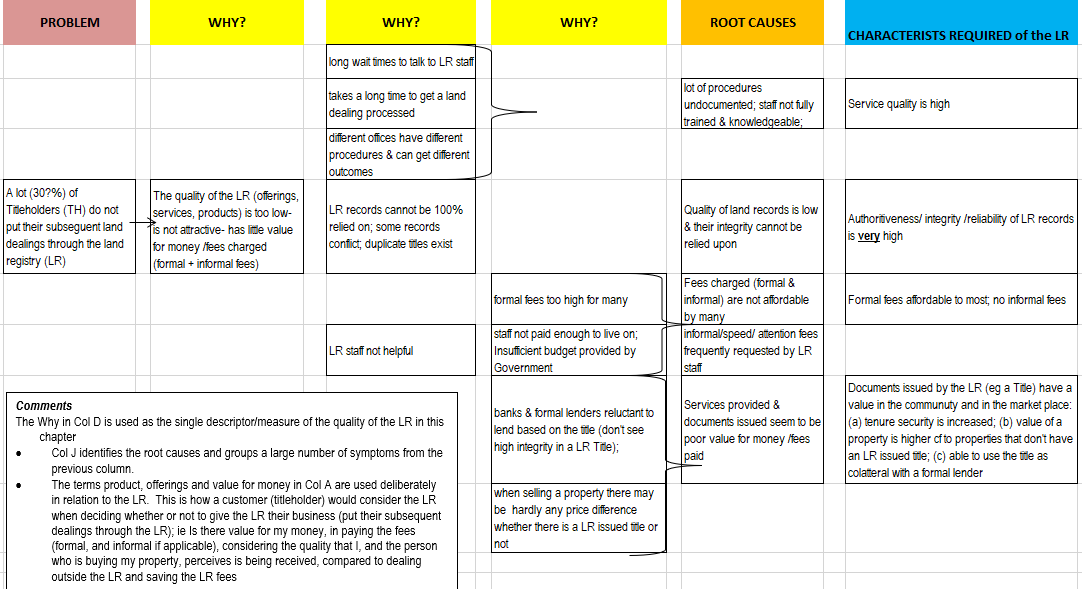
Annex B
The SCS (Schematic of the Core Structure)
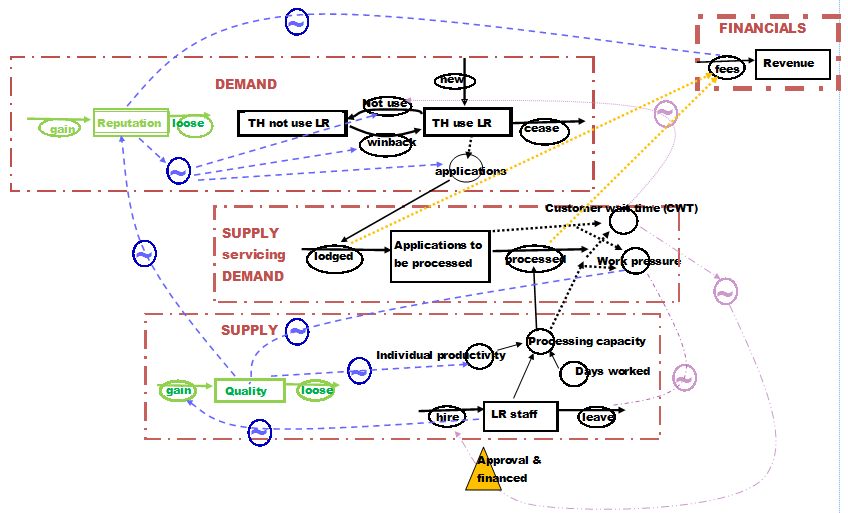
Annex C
A first pass at the graphic form of effects of …..on…..
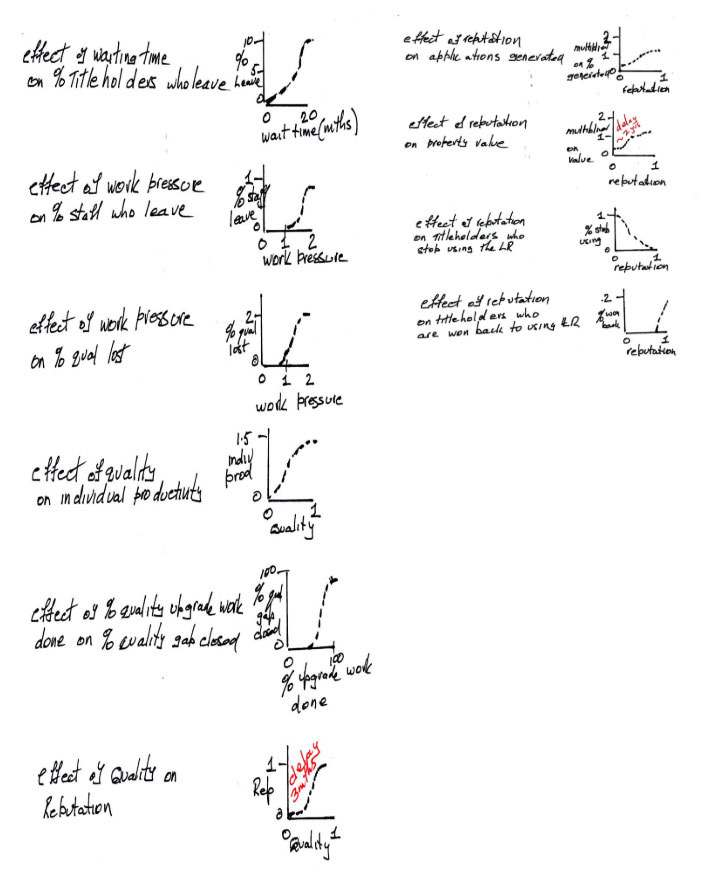
Annex D
Some comments on each PIP
Costs to implement an improvement project in a country can vary widely and depend on many factors, including some of the following: - state of existing situation; what is aimed to be achieved; technologies to be used; exchange rates; institutional and legal requirements; numbers of advisers/specialists and ratio of local to international. Burns et al (2018) Framework for Costing and Financing Land Administration Services (CoFLAS), United Nations Human Settlements Programme (UN-Habitat), is a useful reference8.
As indicated, this is an illustrative hypothetical example so the following relate to the story line of the example.
PIP#1- IDA support provided to significantly upgrade the quality of the LR records and operations
This would be a major undertaking for the LR. Activities to be carried out could include: - digitising key LR records not already done; creating digital land parcel boundaries; integrating LR land records with land parcel boundaries including resolving anomalies; data cleansing and validation; LR procedures and workflows would be updated and LR staff trained. Increased individual productivity would be anticipated. This upgrading would also provide the base property layers of an LIS (land Information System).
TAs (Technical Advisers) would be part of the IDA support. They might cover:- IT (information technology & systems); scanning and verifying LR records; creating digital land parcel boundaries; data integration, cleansing and validation; work flow, procedures, training in updated procedures. ~15 temporary staff could be employed to support the TA. Some temporary staff can act as LR processers and release LR staff to rotate through the upgrade activities as they will be responsible for maintaining the increased quality, post IDA support.
PIP#2 - IDA support provided to conduct awareness and win back campaignto win back the titleholders not currently using the LR(campaign starts at project start)
Awareness activities of what the LR is, and what it does, the value of putting land transactions through the LR, etc., will be necessary before concentrated efforts commence to win back titleholders who do not currently use the LR. It is anticipated that a lot of meetings with local community, business, church, etc, groups will be conducted, as well as the use of radio, social media, TV, etc.
The awareness campaign requires a budget allocation of a certain amount of dollars/per month for a certain number of months. It is assumed that a certain number of titleholders who do not use the LR, can be won back / month /thousand dollars spent on marketing. It is further assumed that reputation will have an effect on the rate of titleholders being won back.
As part of the winback campaign a service could be offered by the LR where property title documents and any subsequent dealings will be examined, verified and documentation and records in the LR brought up to date. The resources for this could be covered in PIP#1, upgrading the quality of the LR.
PIP#3- CombinesPIP#1 (improve the quality of the LR) & PIP# 2 (win back campaign) and both commence at project start
PIP#4- Combine PIPs 1 & 2; PIP#1 starts at project start, but PIP#2 only commences when the Reputation of the LR reaches a designated level
While PIP#1 the LR upgrade commences at project start, the awareness and win back campaign (PIP#2) does not commence until the reputation of the LR has increased from its pre project value (0.5 in this example) to some designated value (0.7 in this example). The rationale is that winning back titleholders will be more effective when the quality of the LR and, hence, its reputation has improved considerably, and that this can be seen by titleholders and the community.
PIP#5 -PIP#4+using some of the increased revenue used to fund:- additional LR staff to maintain the increased quality and to handle increased processing; provide adequate O&M budgets; establish a sinking fund
Winning back titleholders will result in more applications being lodged. This is PIP#4 with additions of:-
- An automatic increase in staff once a threshold has been reached for the number of processing staff needed to ensure there is no build up of a processing backlog. Also an allowance for the necessary staff to maintain the newly attained quality level
- An annual amount allocated for required maintenance/update of all equipment/technology, and also necessary training/updating of staff to retain competency
- An increase in staff salary to provide an adequate living wage so as to reduce any propensity for informal fees
- A regular contribution to a sinking fund for major periodic equipment/technology updating/ replacement
Annex E
The logic and outline mechanics of the PIPs
The purpose of this annex is to give an idea of the logic of the PIPs and an outline of the mechanics of that part of the model that relates to the PIP.
PIP#1 – Upgrade the Quality of the LR
The logic
IDA will improve data, systems, equipment, procedures, workflow, staff skills, office facilities, customer service, etc. and this will increase quality. An increase in quality will cause an increase in reputation, and individual productivity which, in turn, will positively impact, via the feedback loops, on other aspects of demand and supply.
An outline of the mechanics
An outline is shown in Fig E-1.
Fig E-1
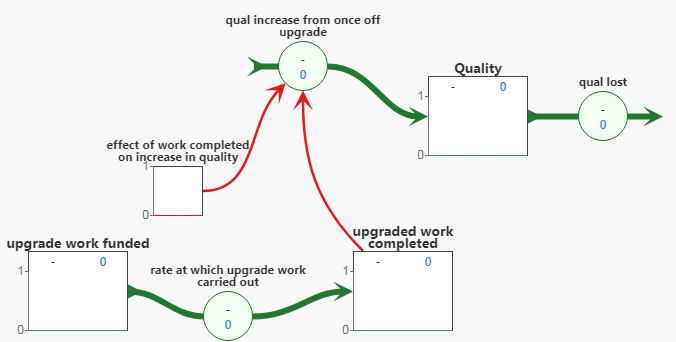
Comments on Fig E-1
- An estimate of the quantity of work required to be done to bring the quality of the LR up to some target value is made by the design team. This is represented by the stock, upgrade work funded. Another stock is shown as upgrade work completed. Until work actually commences there will be nothing in this stock. It will be gradually filled up by its inflow, rate at which upgrade work is carried out. As the upgraded work is completed this will have an effect on increase in quality, as shown by the lookup table, the effect of work completed on increase in quality, and the inflow, quality increase from once off upgrade.
- Red lines indicate incomplete computational paths.
PIP#2 - Conduct the Winback marketing campaign
In Section 9.3.1 the customer pipeline structure was shown. This indicated how customers are won and lost. In section 9.3.2, the word-of-mouth structure was shown by which customers are won by being influenced by satisfied customers.
The logic
Marketing, advertising and community engagement activates the customer pipeline structure and takes the titleholders who no longer use the LR through the various stages of making them aware, informing them and then winning them back to the LR. As more titleholders are won back, and become happy, they pass on recommendations to other titleholders not currently using the LR, who in turn are influenced by this word of mouth recommendation. As more are won back through word-of-mouth, the marketing and advertising campaign can be reduced.
As more titleholders are won back to using the LR, more applications are submitted and revenue increases.
An outline of the mechanics
This was shown in the main text in sections 9.3.1 and 9.3.2. Figs 9.6 and 9.7 refer.
PIP#3 – Conduct PIP#1 (Upgrade the Quality of the LR) and PIP#2 (Conduct the Winback marketing campaign) concurrently with both commencing at project start
The logic
Having both marketing and upgrade start at the same time increases credibility as those marketing can point out that upgrade work is occurring.
An outline of the mechanics
As shown individually above for PIPs#1 and 2.
PIP#4 – Commence PIP#1 (Upgrade the Quality of the LR) at project start but do not commence PIP#2 (Conduct the Winback marketing campaign) until the reputation of the LR has reached ~0.7
The logic
The marketing campaign is likely to be more successful when titleholders and the community can see that the quality of the LR has actually increased and that this can be tangibly seen.
An outline of the mechanics
The mechanics are essentially the same as for PIP#3 with the addition of a counter which notes when the reputation of the LR reaches 0.7, and this starts the win back campaign
PIP#5 – PIP#4 + incrementally increasing LR staff to conduct QA/QC and to process increased applications lodged, to fund adequate O&M, and a Sinking Fund; all to be financed from a small percent of the increased revenue
The logic
Quality will only be maintained at the target level if some resources of the LR are devoted to QA/QC, and if the backlog is kept low. This will require an increase in funding to achieve adequate O&M budgets and a sinking fund. This increase in funding is to be financed from a small % of the increased revenue that resulted from the winback campaign.
An outline of the mechanics
An outline of the mechanics for PIP#4 has been provided above in this Annex. An outline of the mechanics for automatically increasing staff when a work pressure threshold is reached, and for funding this from a small % of fees and taxes collected, was described in Sec 9.3.3 and Fig 9.8.
Annex F
Some observations from testing each PIP for effectiveness and sustainability
- Results were shown in Fig 9.11
Row 2 - Base case -No IDA support -– continue AS IS
No desired future trajectory for any PIO was achieved. Quality and reputation slowly decay over time. At about month 150, applications lodged are greater than processing capacity and the backlog increases significantly from that time. The significant increase in the backlog and therefore waiting time causes more titleholders to stop using the LR. This results in an increase in missed revenue.
Row 3 – PIP#1 - Use IDA support to improve the quality of the LR
IDA provides significant support over a 9 month period to upgrade the records and workflows of the LR. This causes Quality to rise from the existing 0.5 to O.94 for a short time, before declining slowly as there is no ongoing planned quality maintenance. Reputation also rises and then slowly falls, after a delay. Revenue collected increases due to the increase in reputation. However, there is no significant fall in titleholders who do not use the LR or in revenue missed. At about month 180 applications lodged are greater than the processing capacity, and the backlog rises. If the simulation was continued for a longer period the backlog would significantly increase and the dynamics observed in row 2, the base case, would occur. Subdivisions still occur outside the formal system, creating more pseudo titleholders who do not use the LR, and thus missed revenue increases.
Row 4 – PIP#2 - Use IDA support to conduct an awareness & marketing campaign to win back Titleholders who do not currently use the LR
Quality and reputation do not rise above their low starting values and slowly decay over time. The marketing causes a significant increase in titleholders using the LR and a corresponding drop in titleholders not using the LR. However, more titleholders submit more applications and at about month 70 applications lodged are greater than processing capacity. This causes a sharp increase in the backlog and waiting times, which via feedback loops, cause some titleholders who use the LR to stop using it. Revenue collected decrease from about month 120 due to the longer waiting times (stamp duty only being paid when an application is finally processed), and fewer titleholders using the LR.
Row 5 - PIP#3 -PTIP#1 (upgrade quality of LR) and PIP#2 (win back campaign)combined, and both starting concurrently at project start
With IDA support Quality quickly rises but then decays due to lack of maintenance. The winback campaign commences at project start when the reputation of the LR is low. As a result the effectiveness of the winback campaign is lower until reputation reaches 0.7 and higher. Reputation lags quality. Titleholders are won back but more applications are submitted. At ~month 100 applications lodged are greater than processing capacity. This causes a sharp increase in the backlog and waiting times which via feedback loops cause some titleholders who use the LR to stop using it. From about month 120 revenue decreases due to the longer waiting times, (stamp duty only being paid when an application is finally processed), and fewer titleholders using the LR.
Row 6 - PIP#4- PTIP#1 (upgrade quality of LR) and PIP#2 (win back campaign)combined, but with PIP#1starting at project start and with PIP#2starting when Reputation reaches 0.7
Similar to PIP#3 but winback is more effective as it is not started until reputation has risen considerably, and therefore more titleholders are won back. Winback starts ~ 8 months later than in PIP#3. However, at ~month 80 applications lodged are greater than processing capacity which causes a sharp increase in the backlog and waiting times and the dynamics described for PIP#3 also occur.
Row 7 - PIP#5 - PIP#4+ a fraction of the extra annual revenue collected by the LR is used to supplementthe LR’s O&M annual budget to fund:-(a) extra staff to handle the increased processing of applications due to more titleholders using the LR; (b) on going QA/QC to ensure sustainability of the increased level of LR Quality achieved with IDA support: (c) establish a sinking fund to major technology replacement
This is the only PIP where the desired future of every PIO is achieved. With IDA support, quality quickly rises to the target value and is maintained because a part of the extra revenue collected is used to finance staff for QA/QC. As more applications are lodged extra staff are hired as necessary (using a portion of the extra revenue) to ensure demand (applications lodged) is not greater than supply (processing capacity) and that the backlog and waiting times are very low. The increase in revenue is more than sufficient to fund the extra for O&M, and to also contribute more revenue to the government. [This keeps the golden goose (the LR) alive, and keeps producing golden eggs (revenue) for the government].
ANNEX G
ASIDES from TESTING FOR EFFECTIVENESS and SUSTAINABILITY
Aside 1 - The vital necessity to maintain quality and what happens when it is not done
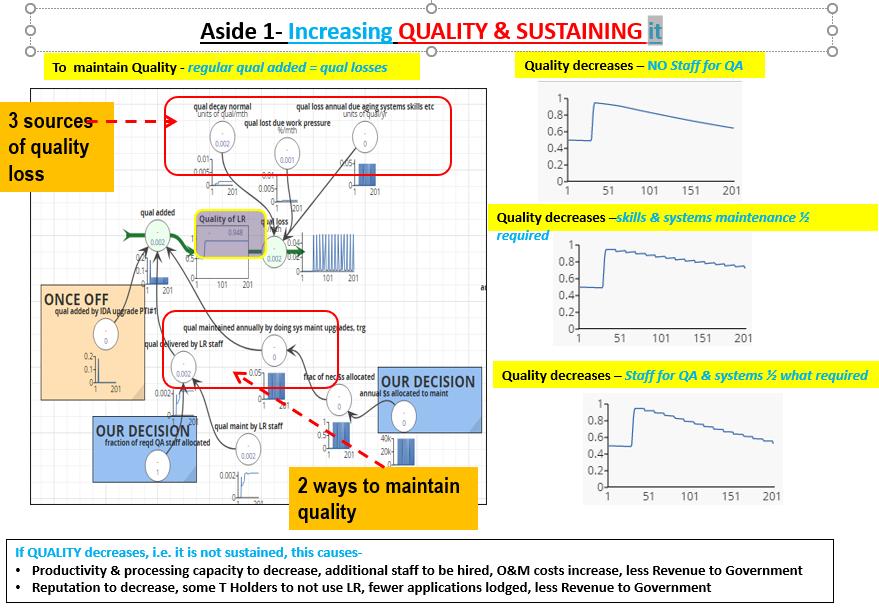
Aside 2 - The ability to handle a sharp increase in new titles, through IRPR (initial recording of property rights)
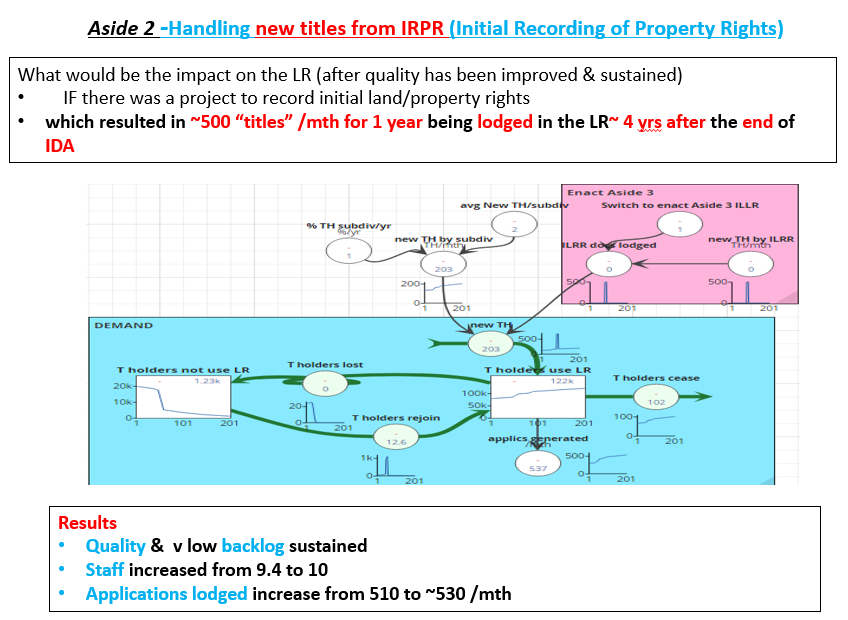
ANNEX H
| Abbreviation | Meaning |
|---|---|
| B/C | Benefit to Cost |
| CBA | Cost Benefit Analysis |
| IC | In-Country |
| IDA | International Development Assistance |
| IRPR | Initial Recording of Property Rights |
| LA | Land Administration |
| LBM | Living Business Model |
| LR | Land Registry |
| M&E | Monitoring and Evaluation |
| O&M | Operations and Maintenance |
| PI | Performance Indicator |
| PIO | Performance Improvement Objective |
| POT | Performance over Time |
| PIP | Performance Improvement Proposal |
| QA/QC | Quality Assurance / Quality Control |
| SCS | Schematic of the Core Structure |
| SD | Strategy Dynamics |
| SF | Sinking Fund |
| TA | Technical Assistance |
| WOM | Word of Mouth |
Footnotes
- 1 In this example quality is treated as an intangible with a rating between 0-1. ↩
- 2 https://www.sdcourses.com/ ↩
- 3 A winback campaign will more likely be effective if customers and the community can see that quality has increased and reputation has risen before the launch of the winback campaign ↩
- 4 Good governance will require adequate financial control and may include such as 5 year forecasts, annual budgets, etc ↩
- 5 To learn how to build models see https://www.sdcourses.com/ ↩
- 6 In Fig 9.9 PTI (proposal to improve) is used synonymously with PIP (performance improvement proposal) ↩
- 7 PIP is used interchangeably with PTI (proposal to improve) ↩
- 8 https://gltn.net/download/framework-for-costing-and-financing-land-administration-services-coflas/ ↩