CHAPTER 8
SUMMARY – APPLYING THE SD APPROACH and
HOW IT ADDS VALUE to IDA for LAND ADMINISTRATION
8.0 Introduction
8.1 Summary of the Strategy Dynamics Approach for Land Administration
8.1.1 What Strategy Dynamics is and What it Does
8.1.2 The Importance of Improving LA in Developing Economies
8.1.3 How the preceding chapters illustrated SD being applied to a LA development task
8.2 Characteristics of the SD approach
8.3 An Indicative Logframe for the Backlog Example
8.3.1 An Indicative logframe for IDA project - Removing a Processing Backlog and Keeping it Low
8.3.2 Relating the inputs, activities, outputs and impacts of the logframe to the SD model
8.3.3 How Designing an IDA Project May Occur and Potential Limitations
8.4 How the SD Approach can help apply Lessons Learnt from LA Project Evaluations
8.5 How the SD Approach adds value
8.6 Places to intervene in a system (leverage points) and their relative power
8.7 Key Points
Tables
8.1 Indicative logframe for IDA project, removing the backlog and keeping it low
8.2 Lessons from LA projects and how the SD approach can help
Figures
8.1 Relating the inputs, activities, outputs and impacts of the logframe to the SD model
Annexes
A. Relating the inputs, activities, outputs and impacts of the logframe to the SD model
B. Places to intervene in a system in increasing order of effectiveness
C. Abbreviations used
CHAPTER 8
SUMMARY – APPLYING THE SD APPROACH and
HOW IT ADDS VALUE to IDA for LAND ADMINISTRATION
8.0 Introduction
The preceding chapters introduced land administration (LA) and international development assistance (IDA) (Chapters 2 and 3), systems and strategy dynamics (SD) (Chapters 3 and 4), and applied them to a simple development task of removing a backlog and keeping it low post aid. (Chapters 4-7).
The purpose of this chapter is to: -
- Provide a summary of the SD approach and its application so far.
- Indicate how the SD approach adds value to IDA for LA, and that the SD approach is an important additional tool in the LA toolbox
- Set the scene for later chapters where more complex LA improvement tasks will be illustrated
8.1 Summary of the Strategy Dynamics Approach for Land Administration
8.1.1 What Strategy Dynamics is and What it Does
What SD is
The SD approach allows time based, quantified and transparent simulation models to be built showing how organisations, and the issues they face, actually functionand perform over time (POT). This makes it possible to work out what to do on all key decisions across a business, and to continually update those insights as circumstances change. Past POT can be replicated, and likely future POTs generated. (Sec 4.1 refers).
What SD does
SD enables bench testing of strategies and policies to make substantial sustained improvements. This is made very clear with POT (performance over time) charts.
A system view solves the challenge of improving POT as a SD model enables (Warren K 2009): -
- The Determination if a plan will work at all
- The design of a system so that it can perform well
- The management of a system so that it does perform well
- The fixing of a system if problems occur
8.1.2 The Importance of Improving LA in Developing Economies
The goals of LA are to: -
- Provide security and enforceability of property rights
- Contribute to social wellbeing and stability
- Contribute to economic development
- Provide a well ordered, regulated and functioning property market
- Provide land services
LA does achieve its goals in developed economies, albeit with variations in legal frameworks and mechanics. Chapter 2, Sec 2.1 refers.
There are eight different operational entities in LA (Fig 2.1) and in each there can be significant differences in status between developed and developing economies (Fig 2.2 Annexes B and C, Chapter 2).
IDA has been provided by aid donors and development banks over many decades, all seeking to improve particular aspects of LA in developing economies (Fig 2.3, Annex D, Chapter 2). Wide spread success and sustainability has tended to be elusive.
During the 1970s-90s the emphasis of IDA tended to be on large scale initial land titling which “brought land onto the formal/legal land register”. This tended to be costly and time consuming. From 2000 there has been movement towards FFP (Fit for Purpose) LA1 and a pro poor approach, largely led by GLTN (Global Land Tool Network)2 and FIG (International Federation of Surveyors)3. This movement recognises a continuum of land rights and has developed a SDTM (Social Domain Tenure Model) which provides the means for community groups to record their property rights and hold the results in the community.
Whatever the assistance focus, the overall aim is to achieve an improvement in performance over time, and for the improved performance to be sustained, post assistance.
Prudent assistance investment calls for the use of a tool that can “test” improvement proposals for efficacy and sustainability, before investing. It is considered that the SD approach is such a tool.
The following sub section summarises how the use of the tool was illustrated in the previous chapters. Subsequent chapters will show more complex use of the tool.
8.1.3 How the preceding chapters illustrated the SD Approach applied to a LA development task
Chapter 4 listed the four principles that underpin SD (Sec 4.2.1) and the eight steps in SD Approach for designing a system so that it can perform well, and the five steps in managing and fixing problems (Sec 4.2.2). These were applied to a LA development task of removing a processing backlog in a LR (with aid), and keeping the backlog low, post aid. This was shown in Chapters 4 to 7. Chapter 7 showed how the SD model could be used as a living business model (LBM) to help manage the improvement both during the aid project and post aid.
The HOW can be summarised as: -
For designing an improvement
- Establish the PIO (performance improvement objectives) and draw POT (performance over time) graphs for past performance, desired future, and feared future performance
Steps 1 and 2 of the SD approach were shown in Chapter 4, Secs 4.3 and 4.4.
- Sketch the SCS (schematic of the core structure) of the system whose performance is sought to be improved; identify KPIs/PIs and their POT; draw preliminary conclusion on the dynamics in play; identifying PIPs
Step 3 & 4 of the SD approach was shown in Chapter 4 Sec 4.8.
This step is important when carrying out pre-feasibility or project design in a developing economy as:-
- It provides: - insights, preliminary conclusion, a good joint learning experience for international specialists and those from the IC agency. It fosters “buy in”
- It does not require the building of a SD model at this stage, while still applying the SD principles
- Build an SD model (based on the SCS) and use it to:-show that that the model can replicate past POT; test the PIPs for efficacy and sustainability; determine the improvement strategy
Steps 5 and 6 of the SD approach shown in Chapter 5.
This step is very important as it numeric, transparent and incorporates simulation. Without an SD model there is no quantification of future POT (performance over time).
- Calculate Cost & Revenues with and without the project; do project evaluation
Step 7 of the SD approach and shown in Chapter 6
Steps 1- 7 are used for prefeasibility or project design. The results can be used for project appraisal.
For managing the improvement
- Use the SD Model as a Living Business Model for M&E
Step 8 – 12 of the SD approach shown in Chapter 7. These are carried out during project implementation or post aid by the IC agency.
8.2 Characteristics of the SD approach
Some general characteristics of systems were listed in Chapter 3, Table 3.1 and particular characteristics were illustrated in Chapters 4 -7.
In general from Chapter 3
- The characteristics and consequences of a system were listed in Chapter 3 Table 3.1. They are:-
- Handles accumulation (critical factors that build up and deplete over time)
- Handles interdependencies (change depends on more than one factor)
- Incorporates feedback (interdependencies cause changes that either accelerate or slow their own progress)
- Takes into account nonlinear cause and effect (interdependencies) via feedback loops which are characteristics of system behaviour
- Captures threshold effects (the system is unresponsive to change for some time, then switches to a new mode)
- Handles intangibles (e.g. morale, reputation)
In particular from Chapters 4-7
- Identifying the performance challenge and the system to be improved allows the PIO (performance improvement objective) to be determined.
- The SCS (schematic of core structure) of the model, which can be quickly and easily sketched, enables an easy understanding of the fundamental dynamics of the situation (the backlog in the first example); what is driving what, and why, and what the proposed PIPs (performance improvement proposals) will affect. All before a SD model is built
- The SD model allows the likely future POT (performance over time) of PIPs to be numerically, transparently and quantitativelyestimated. Any number of What Ifs can be quickly run and the results evaluated.
- The SD model quickly allows the PIP combination that best aligns with a desired future POT trajectory to be determined, and hence, identifies the improvement strategy.
- Risk can be examined and quantified by the use of What Ifs and the resultant risk management strategy can be incorporated into the improvement strategy
- SD models are completely transparent. There is no black box. There are no implicit assumptions. The logic, variables and assumptions are explicit in the model and can be quickly and easily modified. The model provides new results instantaneously. SD models show, quantitatively, how fast things are changing, by how much performance might be improved, and over what time periods.
- While it is be possible to examine PIP using spreadsheets, it is not as easy as using SD software such as Silico, especially when SD models become more complex.
- Based on the above it can be seen that using the SD approach, it is possible to test PIPs for effectiveness and sustainability as part of pre-feasibility or project design, and before large development $s are committed.
- The SD model can be thought of as a “digital twin” of the project.
- The SD approach is a powerful tool for: -
- design, for understanding complex situations, and for determining the likely magnitude and timings of outputs and impacts that result from certain inputs and assumptions
- learning and “buy in” during design where the design team comprises a mix of international specialists, in country specialists and land agency staff
- Generating time based action plans
- Use of the SD model is not restricted to pre-feasibility or design. It can also be used in design appraisal, internal project M&E, and formal project reviews by the IDA donor and IC sponsor.
- In design appraisal, the IDA donor would send the project documentation, including the SD model) to a number of independent reviewers, generally including an IDA project design specialist and a subject matter technical expert. Having an SD model would make it much easier for the reviewers to understand very clearly the whys, whats, hows, and whens.
- For regular internal project M&E, the SD model can include actual tracking data compared to the target data generated by the model. If remedial action is deemed necessary, various actions can be tested using the model, decided on, and adjusted future targets set. Close tracking of the KPIs/ PI (Performance Indicators) pays dividends. Illustrated in Chapter 7.
- Formal project reviews may be carried out annually and tend to be wider ranging than the monthly internal M&E. However, using the SD model as an LBM ensures a focus on the KPIs/ PIs of the project. Also, during the reviewing meeting any projected changes can be modelled and then discussed for likely effectiveness and sustainability.
Summation
Using SD approach provides the means, Warren (2009), to: -
- Determine if a plan will work at all
- Design a plan capable of high performance
- Manage the plan so that it does perform well
- Fix things when they go wrong, or when opportunities open up
The big contribution of Strategy Dynamics is that it:-
- Explains how and why systems generate the changes to performance outcomes that occur over time
- Enables bench testing of strategies and policies to make substantial sustained improvements to those outcomes
- Assist the ongoing performance management of projects by enabling revised performance targets to be set and monitored
- Makes the above very clear with performance time-charts
The important point-
- Is not the simple backlog example slowly illustrated in Chapters 4-7, nor the results obtained,
- But is the logical, explicit and quantified approach illustrated, which can be applied to any development task in LA (land administration)
8.3 An Indicative Logframe for the Backlog Example
The following section provides an indicative logframe for the backlog example and shows how the activities and outputs of the logframe can be related to the detail of the SD model. An indicative theory of change diagram could also have been developed but has not been done at this time, as the results while different would not have markedly changed Sec 8.4, How the SD approach adds value.
8.3.1 An Indicative logframe for IDA project - Removing a Processing Backlog and Keeping it Low
If IDA was to be provided to remove a large backlog in an LR and to keep the backlog low post IDA, then the outcome, outputs, verifiable indicators, activities and assumptions in logframe form might be along the lines shown in Table 8.1.
Table 8.1
| Outcome / Output / Activity | Verifiable Indicators | Assumptions |
|---|---|---|
| Outcome | ||
| Processing backlog is removed and kept low without any future IDA. |
|
|
| Outputs | ||
| O1 — Backlog is removed and kept low | Backlog: applications awaiting processing. |
|
| O2 — Improved LR procedures |
|
|
| O3 — Staff trained and skills increased |
|
|
| Activities for Output 1 | ||
| A1.1 — Process applications awaiting processing |
|
|
| Activities for Output 2 | ||
| A2.1 — Improve LR procedures where changes can be approved by the DG Director General of Lands; train LR staff and implement. |
|
|
| A2.2 — Improve LR procedures that require approval by government or parliament Train staff to use the procedures when approved for use. |
|
|
| Activities for Output 3 | ||
| A2.3 — Train LR staff and increase skills |
|
|
In practice the logframe would be larger, but the above captures the essence.
8.3.2 Relating the inputs, activities, outputs and impacts of the logframe to the SD model
The SCS (schematic of the core structure) for the PIPs (performance improvement proposals) (e.g. Annex F of Chapter 4) gives an indication of inputs, activities, outputs and impacts, while Annex B of Chapter 5 shows an image of the SD model structure of each PIP.
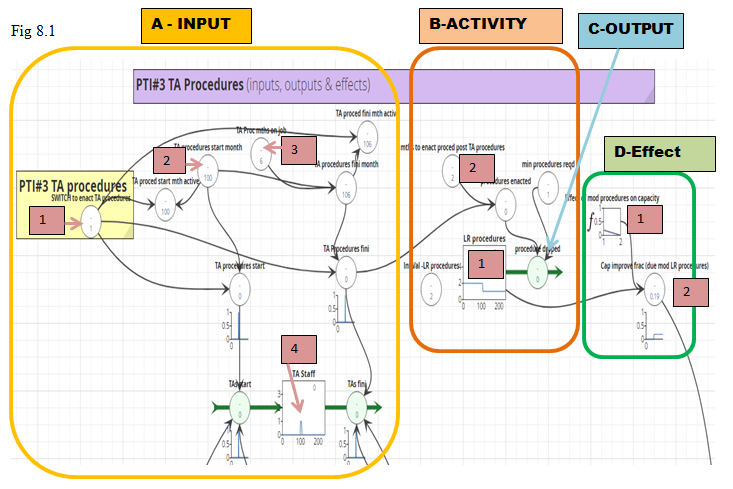
Activity A2.1 in the logframe of Fig 8.1 is improving LR procedures that can be changed with the approval of the DG of Lands. This activity is one of two that constitute Output 2, Improved LR Procedures.
Fig 8.1 (from Annex B, Chapter 5) shows part of the SD model that relates to Activity A2.1. It highlights the input (A) by a TA, the activity (B) the TA undertakes, the resultant output (C), and the impact (D) that the output has on individual productivity.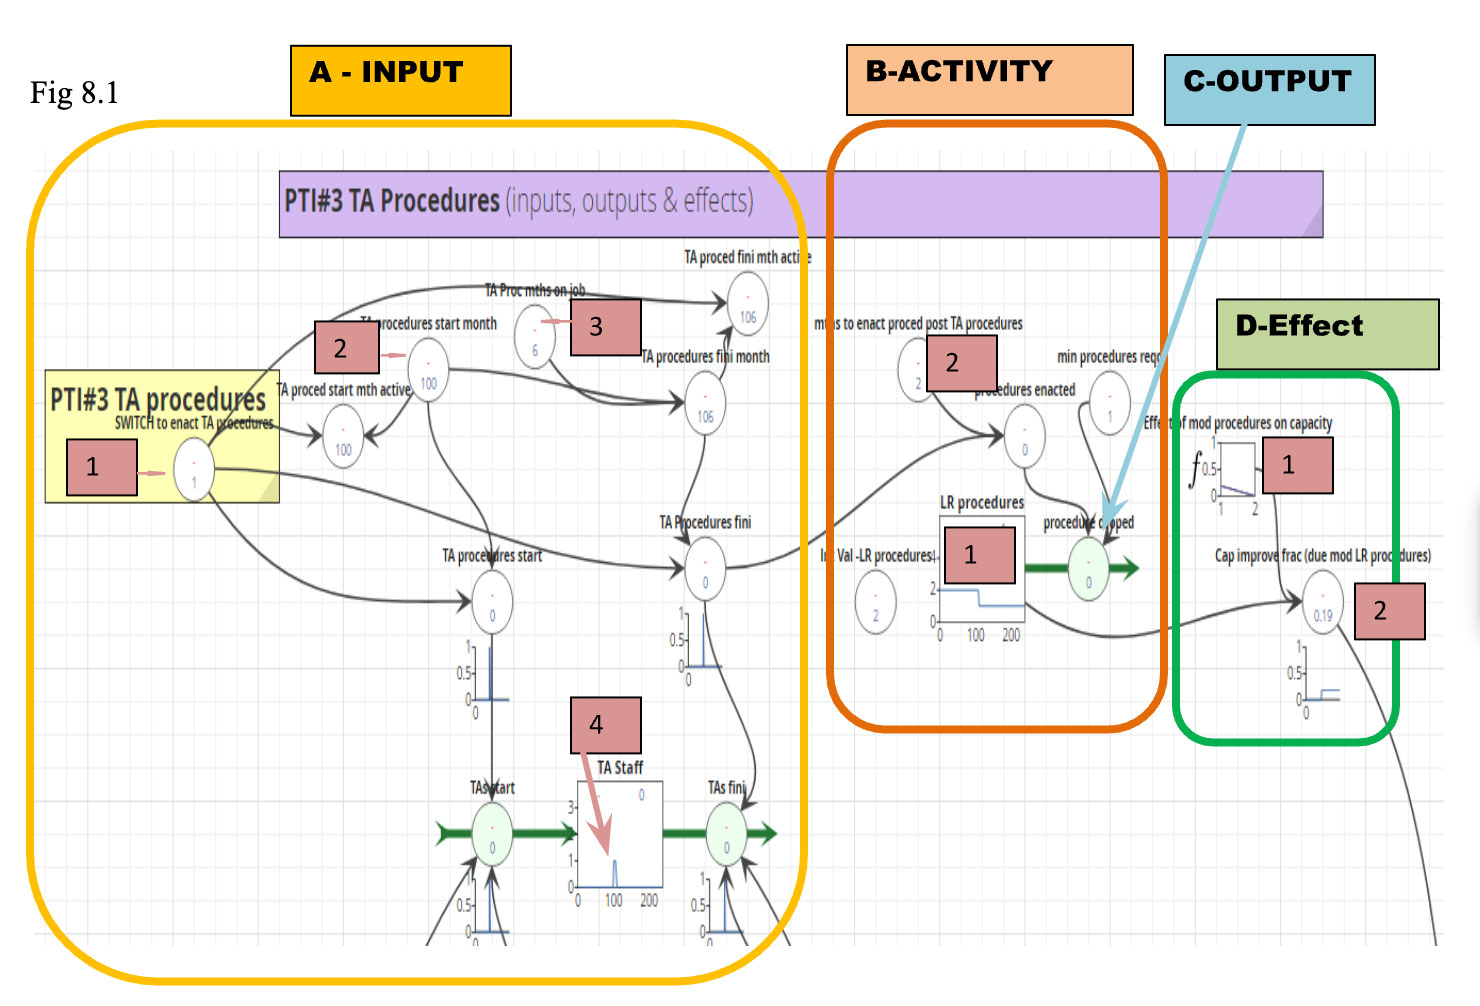
An image of the above in landscape is at Annex A. Some notes follow. It can be seen that activity, output, impact logic of the logframe is also contained in the SD model, but in a different way.
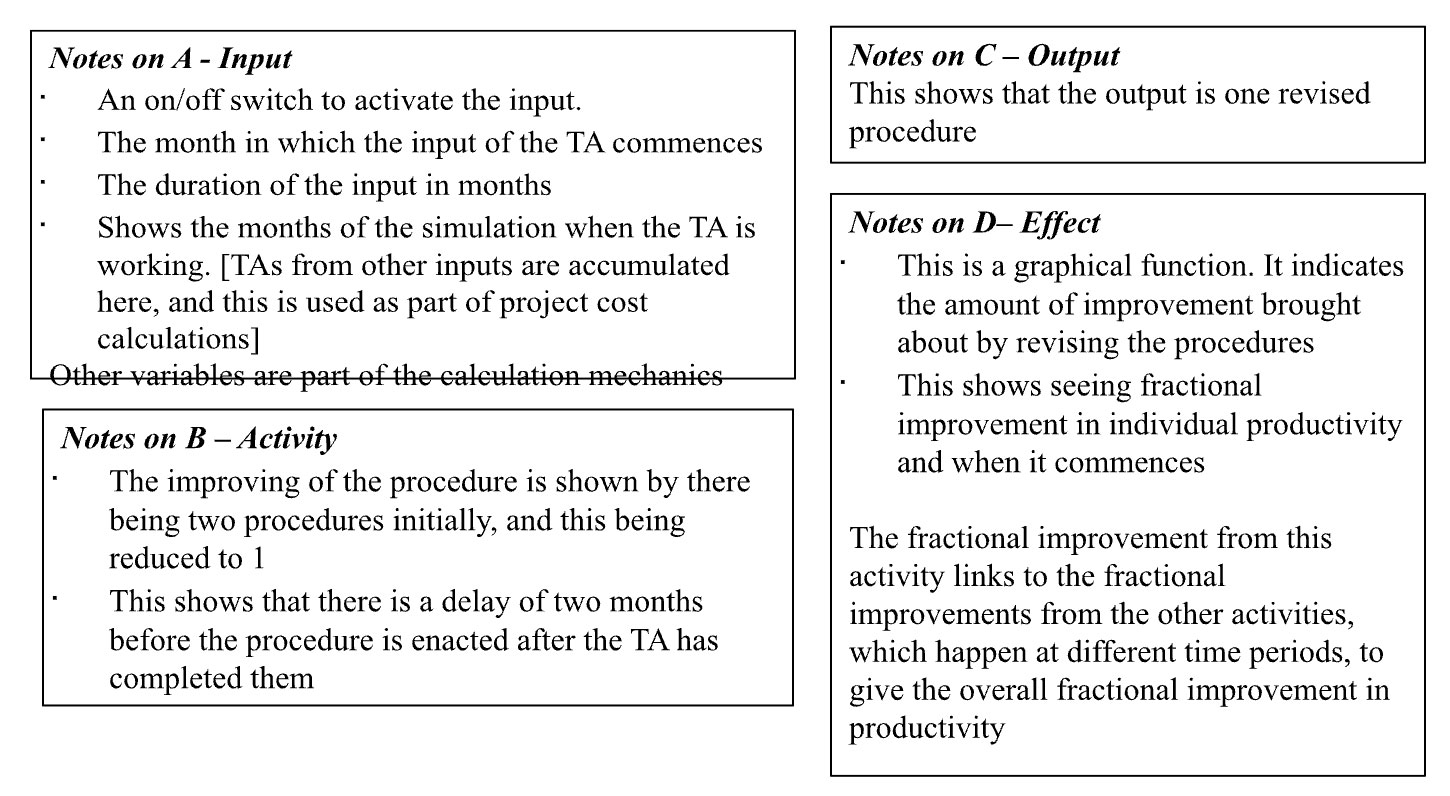
Some features of SD models that Fig 8.1 illustrates
- The transparency of the development logic (what causes what and by how much) can be clearly seen. An input of TA (technical adviser) commences in month 100 for duration of six months. The activity carried out to improve the procedures (shown by reducing the procedures from 2 to 1). The procedures are not enacted until month 109, two months after the end of the TA input. The improved procedures are estimated to improve individual productivity by 0.2.
- The quantifiable nature can be clearly seen. The numbers associated with all variables, stocks, inflows and outflows are clearly visible.
- It is very easy to modify the model. The input month or the duration of the TA can be changed simply by clicking on the relevant variable and entering a different number. Similarly for delays before enactment, and the effect that the improved procedures is assumed to have on individual productivity. The logic of the model can also be modified if required.
Other comments
Figure 8.1 illustrates only one of the four activities in the logframe of Table 8.1. These four activities are shown as PIPs #1 to 4 in the SD model (Fig 5.1 refers).
The full model is composed of a number of linked sections for demand, supply, supply servicing demand, PTIs, costs and revenues. These linked sections illustrate another feature of SD models, that of being integrated. A change in one variable (say in input duration), is immediately reflected in other parts of the model (e.g. when the output is achieved, what effect the output has, changes in costs and revenue).
The simulation time period can extend for many months or years after the end of IDA support and does not have to be of the same duration as the IDA project. This is important when the sustainability of improvements, post project, is being examined.
8.3.3 How Designing an IDA Project May Occur and potential limitations
How Designing an IDA Project May Occur
There are a variety of ways that IDA projects may be designed, depending on the procedures used by particular donors or development banks. The following may occur: -
- In country (IC) discussions between representatives of the aid donor/development bank, the government entity responsible for IDA, and the agency (e.g. Lands Department) seeking the IDA to improve some particular aspect, leading to agreement that IDA is worth examining in detail.
- The aid donor /development bank assembles a design team to visit and to work with IC agency counterparts to design an IDA assistance project. The full project write up is generally done after this IC visit and not done IC.
- The designed and costed project, conforming to aid donor/development bank templates and procedures, is considered by the aid agency and the IC agencies and, after discussion, modifications and assessment, may be approved for IDA.
- The IDA provider arranges for a contractor to be appointed to execute the project in collaboration with the appropriate IC agency.
- An important part of the design documentation is the logframe or the theory of change diagram which seeks to encapsulate the development logic and indicate the inputs, outputs and impacts (Chapter 3 refers). Project costings are generally carried out on spreadsheets separate from the logframe.
Potential Limitations
Some potential limitations are: –
- The time IC for the design team may be limited. A preliminary version of the logframe tends to be done IC with a more detailed one done together with detail costing spreadsheets, post IC visit. There can be limited time IC for detailed discussions between the visiting members of the design team and IC agency counterparts.
- Full project documentation may not be available to IC agency staff for some time after the design teams IC visit. Documentation may not be easy to understand for those in the IC executing agency not familiar with the particular IDA formats. Queries from IC technical staff of the land agency may not be able to be clarified by IC aid donor staff.
- The above can lead to different or incomplete understandings between the visiting design members and the IC counterparts, on the objectives of the IDA project, and the whys, hows, whats and by whens. This may lead to shallow buy in by IC personnel who have to participate in the project and live with the results, post IDA.
8.4 How the SD Approach can help apply Lessons Learnt from LA Project Evaluations
Several relatively recent reports4 provide assessments and lessons learnt from the World Bank and the UK (United Kingdom) DFID (Department for International Development) projects in LA. There is a wealth of information in these papers. These papers cover a large number of projects in many countries and, while dealing with LA, have some differences in focus.
All of these papers make the points that LA is complex, that sustainability must be designed for, that it will take time to happen, and that the flow of all benefit types is not axiomatic. The lessons outlined in these papers have been consolidated and then encapsulated into those shown in the first column of Table 8.2. The remainder of the table indicates how the SD approach can help and where in the book there are example of this.
Table 8.2
| Lessons Learnt | How the SD Approach Can Help | Remarks |
|---|---|---|
| Objectives must be well defined. Country and context need to be taken into account. |
|
|
| Sustainability considerations are vital. They need to be central to project considerations. |
|
The conditions for maintaining sustainability post aid are examined closely in each of the different examples in this book. |
| Considering and building capacity is very important. This applies both to implementation and to sustainability post aid. |
|
|
| Long-term support is required. Undertaking land reform and improving land administration requires long-term support from donors and in-country governments, including strong political will and ownership by in-country agencies. |
|
Tangible inputs are shown in some detail in the backlog example. Intangibles such as quality, reputation and morale are shown in the example in Chapter 9. The use of other intangibles is shown in the examples in Chapters 11 and 12. |
| Commence projects with the existing legal framework if possible. Legal improvements can then be sought. |
|
Delays before legislation is passed, and the effect this has on performance, were illustrated in the backlog example and are also illustrated in the Chapter 12 example, where interdependency is involved. |
| There is no single preferred institutional model for LA projects. This includes whether agencies responsible for the Land Registry and Cadastre should be combined or separate. |
The effect of agencies cooperating, or not cooperating, can be incorporated into a model. For example, agencies may or may not share data sets so that the quality of both can be improved. The likely effect on quality and the PIOs can then be quantitatively examined. | The effect of agency cooperation, or lack of cooperation, is incorporated into the example in Chapter 11. |
| Improvements in land tenure alone are insufficient. They do not guarantee the full flow of all benefit types, and projects should not be overloaded. |
|
The first lesson learnt in this table referred to the need for clarity of objectives. |
8.5 How the SD Approach adds value
In summary the SD approach adds value to design methods that use a logframe or a theory of change diagram/description or similar by: -
- Complementing existing approaches with a deeper dimension that explains how and why systems generate the changes to performance outcomes that occur over time and enables the bench testing of strategies and policies to make substantial sustained improvements to those outcomes. This is made very clear with performance time-charts
- Being fully logically explicit, transparent, and quantifiable and combining all aspects in a single model. A change in any variable (e.g. the duration of a TA input) immediately computes through to change the quantum and timing of an output, and costs etc.
- The compilation of a SCS, before building a model, allows many useful insights into the dynamics at play in a system
- Using the SD model not just for design, but also for project appraisal, for M&E throughout IDA support, for formal reviews, for M&E post IDA by the IC agency. i.e. using the SD model as a living business model (LBM)
- Having the characteristics listed in Sec 8.2
- Being, fast, reliable and relatively easy (after some initial training and experience). The approach saves work and does not make work.
- Being a powerful design learning tool for understanding complex situations. It helps determine the likely magnitude and timing of outputs and impacts that result from the inputs and the assumptions that underpin the model. It can be a particularly powerful learning tool during design where the design team comprises international specialists, local professionals, and IC land agency personnel.
- The SD approach has a focus on determining/testing if a proposed improvement plan is likely to achieve stated objectives, and if not then designing a plan that will. [The literature, formal and grey, tends to have much on the appropriate use of technology, but much less on pre-testing if a plan is likely to achieve its objectives].
Thus the SD approach is seen as a worthy additional tool to the LA toolbox
The Pain -Gain equation
There is always some pain in considering, examining, learning, trialling, and deciding if a new or modified approach is worth adopting operationally. There is an investment in time and effort which is hoped will be repaid in the future by improvements in productivity, quality, or sustainability of improvements.
It is hoped that this first simple example (& other examples in the following chapters) will provide illustrations and initial learning material, sufficient to show how the SD approach adds value, and encourage readers to “give it a go”.
Some steps to learning more- reducing the pain
The following provide some steps to learning more.
| Resource | Description | Link |
|---|---|---|
| Meadows D. (2008) Thinking in Systems, Chelsea Green Publishing, USA |
A primer on System Dynamics. | — |
| Warren K. (2010) Strategy Dynamics Essentials, Strategy Dynamics Ltd |
The basics of Strategy Dynamics. | — |
| Warren — Agile SD | A short free course of 49 online lessons on how to build System Dynamics models. | View course |
| Warren — Business Modelling: Getting Started | A course of 24 online lessons. | View course |
| Warren — Business Modelling: Core | A course of 95 online lessons. | View course |
| Warren — Business Modelling: Extensions | A course of 108 online lessons. | View course |
8.6 Places to intervene in a system (leverage points) and their relative power
Meadows D H (1998) identified twelve different places, termed leverage points, to intervene in complex systems. Leverage points are places where a small shift in one thing can produce big changes in everything. The twelve different places have increasing order of effectiveness and are shown at Annex B. For simplicity in LA, Lyons et al (2010) reduced the 12 to 4. They are: -
- Improving the rate at which work is done - Low-Medium effectiveness
- Addressing the feedback loops - Medium – High effectiveness
- Changing the rules of the system and focusing on achieving the goals of the system -High-Very High
- Changing the mould/paradigm - Very High effectiveness
The first area tends to apply to discrete subsystems. e.g. a Land Registry. The second and third areas are best considered in a current whole system context. The last fundamentally involves a completely different system and way of doing things.
The importance of considering the whole system is well illustrated by the following homily, believed to have originated from a British Airways senior executive seeking to illustrate the futility of conducting capacity building for personnel, while ignoring the system in which the personnel work. Imagine a group of goldfish sluggishly swimming around in a bowl filled with murky water. The goldfish are taken out in groups, resuscitated and treated at a day spa, and then thrown back into the same murky water. They operate well for a day and then resume their original behaviour of swimming sluggishly.
The following examples of activities in LA that could fall in each of the four area were listed in Lyons et al (2010).
1. Improve the rate at which work is done: (L-M effectiveness)
- Support activities that improve the rate of achieving key performance variables
- Foster senior management involvement to achieve sustainability
- Collect due and avoided fees
2. Address the feedback loops: (M-Heffectiveness)
- Establish incentives and use penalties (carrots & sticks)
- Widely provide information on LA system performance, and support customers
3. Change the rules - focus on achieving the system goals: (H-VHeffectiveness)
- The Land Agency to focus on the achievement of the goals of LA and the establishment and proper operation of all the elements of LA, compliance checking and enforcement, rather than focusing on and being the sole service provider.
- Allow the competitive provision of a range of land services which could be via the private sector, churches, NGOs, etc
- Have the authority “to approve” be based on personal independently certified competency (irrespective of which sector a person is in), rather than on being appointed to a certain position in a government department5
- Aid donors to provide IDA to all involved, and not predominately to Government Land Agencies
4. Change the mould/ paradigm: (VH effectiveness)
- Allow locally based deposit of records and agreements
- Treat land/property dealing as a purely commercial legal contract
- Have a system based on local culture, e.g. “the Melanesian Way”
- Allow Title insurance
The first backlog example falls in areas 1 and 2 where trying to both improve the rate at which work is done and also addressing the feedback loop where long waiting times cause titleholders to stop using the LR.
8.7 Key Points
- The SD approach is a powerful learning tool for: understanding complex situations; testing PIPs for efficacy and sustainability; identifying an improvement strategy. It can be particularly powerful where a design team comprises international specialists, local professionals, and IC land agency personnel as it builds joint understanding and assists “buy in”.
- The SD approach adds value, not just to pre-feasibility and project design, but also to project appraisal, normal monthly project M&E, and annual project reviews. It can be used post IDA by the Land Agency.
- There are a number of different places to intervene in a system, with varying levels of effectiveness.
- Using the SD approach provides the means, Warren (2009) to:
- Determine if a plan will work at all
- Design a plan capable of high performance
- Manage the plan so that it does perform well
- Fix things when they go wrong, or when opportunities open up
- The important point:
- Is not the simple backlog example slowly illustrated in Chapters 4–7, nor the results obtained,
- But is the logical, explicit and quantified approach illustrated, which can be applied to any development task in LA (land administration)
- The SD approach is seen as a worthy additional tool to the LA toolbox. Much literature, formal and grey, provides views on the appropriate use of technology, but there is much less on the quantitative achievement of strategic objectives.
The Next Chapter
The next chapter covers a more complex example in an LR where several improvement objectives are sought to be achieved. Quality and reputation (intangibles) are sought to be significantly increased, together with winning back a significant percentage of titleholders who do not currently use the LR, with a subsequent rise in revenue, and a small portion of the increased revenue being used to ensure adequate O&M (operation and maintenance) budgets, and sustainability of improvements post aid.
References
English C, A Locke, J Quan, J Feyertag, (2019). Securing land rights at scale: Lessons and guiding principles from DFID land tenure and land sector support programmes. https://www.researchgate.net/publication/333658289_Securing_land_rights_at_scale_Lessons_and_guiding_principles_from_DFID_land_tenure_regularisation_and_land_sector_support_programmes_NonCommercial_Licence_CC_BY-NC_40
Lyons K, and D Hebblethwaite (2010), Using Microworlds to Improve Success and Sustainability in Land Development Assistance Endeavours, FIG Congress Sydney
Meadows D H, (1998), Leverage Points – Places to Intervene in a System, USA, Sustainability Institute,
Payne, G., Mitchell, J., Kozumbo, L., English, C. and Baldwin, R. (2015). Legitimate land tenure and property rights: fostering compliance and development outcomes. London: DAI. https://assets.publishing.service.gov.uk/media/57a0896ded915d622c0001f9/61566-REA-Land-Q2publish.pdf
Satana S, Torhonen M, Anand A, Adlington G, (2014), Economic Impact of 20 Years of ECA Land Registration Projects, Annual World Bank Conference on Land and Poverty. Washington DC, USA. March 24-27, 2014. https://www.oicrf.org/documents/40950/43224/Economic+impact+of+20+years+of+ECA+land+registration+projects.pdf/cd8a94c5-3f04-3e0e-8c9f-6d5413e663fa?t=1510229848480
Torhonen, M (2016). Keys to Successful Land Administration, Lessons Learnt in 20 Years of ECA Land Projects. World Bank. https://openknowledge.worldbank.org/handle/10986/24623
Warren K (2009), Strategic Management Dynamics, John Wiley and Sons Ltd
World Bank (2016). Lessons from Land Administration Projects: A review of Project Performance Assessments. IEG Category 1 Learning Product. March 31, 2016. https://openknowledge.worldbank.org/handle/10986/24407?show=full&locale-attribute=en
ANNEX A
A LARGER IMAGE OF PIP#3 from the MODEL
ANNEX B
Meadow’s 12 places to Intervene in a System
(in increasing order of effectiveness)
12. Constants, parameters, numbers (such as subsidies, taxes, standards)
11. The size of buffers and other stabilising stocks, relative to their flows
10. The structure of material stocks and flows (such as transport networks, population age structures
9. The lengths of delays, relative to the rate of system change
8. The strength of negative feedback loops, relative to the impacts they are trying to correct against
7. The gain driving positive feedback loops
6. The structure of information flows (who does and does not have access to what kinds of information)
5. The rules of the system (such as incentives, punishment, constraints)
4. The power to add, change, evolve or self-organise system structure
3. The goals of the system
2. The mindset or paradigm out of which the system – its goals, structure, rules, delays, parameters- arise
1. The power to transcend paradigms
ANNEX C
| Abbreviation | Meaning |
|---|---|
| DFID | Department for International Development |
| DG | Director General |
| FIG | International Federation of Surveyors |
| FFP | Fit for Purpose |
| GLTN | Global Land Tool Network |
| IC | In-Country |
| IDA | International Development Assistance |
| KPI | Key Performance Indicator |
| LA | Land Administration |
| LBM | Living Business Model |
| LR | Land Registry |
| M&E | Monitoring and Evaluation |
| O&M | Operation and Maintenance |
| PI | Performance Indicator |
| PIO | Performance Improvement Objective |
| POT | Performance over Time |
| PIP | Performance Improvement Proposal |
| SD | Strategy Dynamics |
| SDTM | Social Domain Tenure Model |
| SCS | Schematic of the Core Structure |
| TA | Technical Adviser |
| UK | United Kingdom |
Footnotes
- 1 https://fig.net/resources/publications/figpub/pub60/figpub60.asp ↩
- 2 https://gltn.net/ ↩
- 3 http://www.fig.net/ ↩
- 4 Satana et al (2014); Payne et al (2015); World Bank (2016); Torhonen (2016); English et al (2019). ↩
- 5 The need to checks, balances and independent audits is recognised ↩