CHAPTER 5
TESTING the PERFORMANCE IMPROVEMENT PROPOSALS
for EFFECTIVENESS and SUSTAINABILITY
5.0 Introduction
5.1 Outline of the SD Model
5.2 Showing that the SD model can replicate past POT (performance over time)
5.3 Testing PIPs for Effectiveness and Sustainability and Results Obtained
5.3.1 The Test for Effectiveness and Sustainability
5.3.2 The results from testing the PIPs
5.3.3 The PIP that is the the most effective and sustainable and WHY
5.4 Determining the Improvement Strategy – 1st Pass
5.5 Risk Identification, What Ifs, Risk Mitigation, 2nd Pass at Improvement Strategy
5.5.1 Risk Identification
5.5.2 The What Ifs and what they indicate
5.5.3 Risk mitigation
5.5.4 A 2nd Pass at the improvement strategy
5.6 Gantt Chart – 1st Pass
5.7 What has been shown in this Chapter
5.8 Some things that could be added to the SD model
5.9 Some characteristics of the SD approach
5.10 Key Points
Tables
5.1 Framework for risk analysis
5.2 The What Ifs
5.3 What the What Ifs indicate
Figures
5.1 An image of the SD model built
5.2 a-f Shows the model can replicate past POT
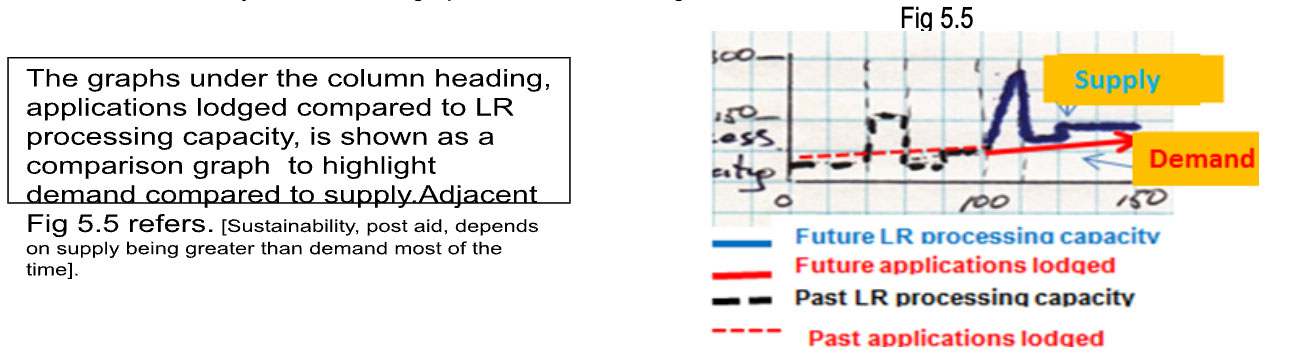
5.3 Past POT for applications lodged compared to LR processing capacity
5.4 Learning from bench testing – a light hearted look
5.5 POT of past and desired future comprision graph for supply and demand
5.6 Future POT for PIs as a result of Testing PIPs for effectiveness and sustainability
5.7 Future POT for PIs as a result of What Ifs based on PIP#6
5.8 Gantt chart – 1st pass
Annexes
A. Image of full SD model
B. Image of PIPs from model
C. Improvement strategy – 2nd pass
D. Abbreviations Used
CHAPTER 5
TESTING the PERFORMANCE IMPROVEMENT PROPOSALS
for EFFECTIVENESS and SUSTAINABILITY
To understand what is going on takes sense -To understand what to do about it takes wisdom
[Chinese Proverb]
5.0 Introduction
In Chapter 4 a SCS (Schematic of the Core Structure) was developed (Figs 4.15e) which illustrated diagrammatically the system of generating and processing applications in a LR (Land Registry), together with some PIPs (Performance Improvement Proposals) to remove the processing backlog (with aid) and to keep it low (post aid) (Table 4.3).
The purpose of this chapter is to:-
- Outline the SD (strategy dynamics) model that was developed based on the SCS
- Show how PIPs can be tested for effectiveness and sustainability using the SD model.
- Show and discuss the results obtained from testing the PIPs for effectiveness and sustainability
- Show how an improvement strategy can be determined [to remove the backlog (with aid) and to keep it low (post aid)]
5.1 Outline of the SD Model
Building the SD model is Step 5 in the SD approach (Sec 4.2.2). The aim of this booklet (Chapter 1) is to outline the SD approach and show, via a number of illustrative examples, how it can be used to test PIPs for efficacy and sustainability duringproject design and before large $s are committed. The aim is not to go into the detail of how to build a SD model1.
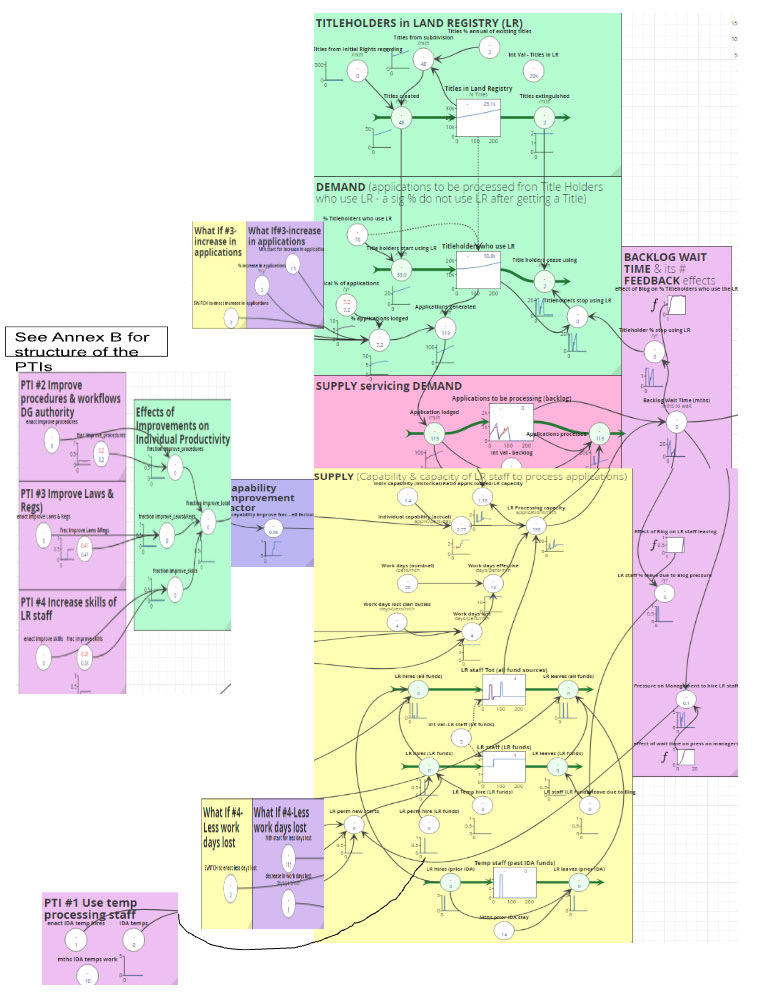
An image of the essence of SD model built, based on the SCS of Figs 4.15e, is shown as Fig 5.1. Fig 5.1 is almost identical to the model that was slowly built up in Chapter 4 Sec 4.5 to 4.7 when illustrating the SD principles. An addition in Fig 5.1 is showing the four PIPs and their effects on individual capability/productivity. An image of the full model is shown at at Annexes A and B.
Fig 5.1
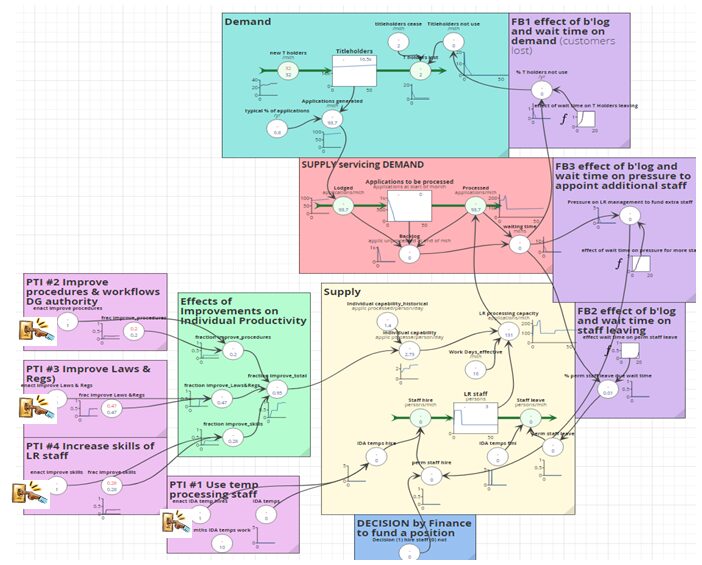
Notes
- The PIPs2 in Fig 5.1 and Annex A are shown schematically to aid clarity. The structure of each PIP is shown in Annex B
- “Switches” were incorporated to allow the results of each individual PIP to be determined, alone or in any combination
- The model building and structure is very similar to the simple model built and explained in Chapter 4 when illustrating the four principles that underpin SD.
- The SD model was developed in stages following the Agile SD method of Warren (2018).
- In Chapter 6 another section has been added to the model dealing with the financials (costs and revenues) and evaluation
- As the purpose of this chapter is to show the results from using the model, the model itself is not described in this booklet in any detail; contact the author for details at [email protected]
5.2 Showing that the SD model can replicate past POT (performance over time)
This is part of step 5 in the SD approach. A vital step is to show that the SD model can replicate past POT; ie reproduce the past POT backlog as illustrated in Fig 4.1 of Chapter 4. If past POT can be replicated it provides some confidence in the model. In Sec 4.10.1 backlog (the PIO, performance improvement objective) and individual capability /productivity were identified as a KPIs (key performance indicators), while others were identified as PIs (performance indicators).
Past POT, using historical data from the last 100 months, were able to be compilied for:- the backlog (applications), applications lodged (applications/mth), LR staff (number). Figs 5.2a, b, c show how the SD model (blue lines) has been able to closely replicate past behaviour (red lines). In Fig 5.2c the red and blue lines are identical and the red line is hard to see.
Some data points were able to be estimated for several periods since the previous aid finished at month 50 and month 100 (the current month) for:- waiting time (mths), individual processing capability (applications processed/person/day), LR processing capacity (applications/mth). Figs 5.2d, e, f shows in red these estimated data points. They lie reasonably close to the model trajectory (the blue line).
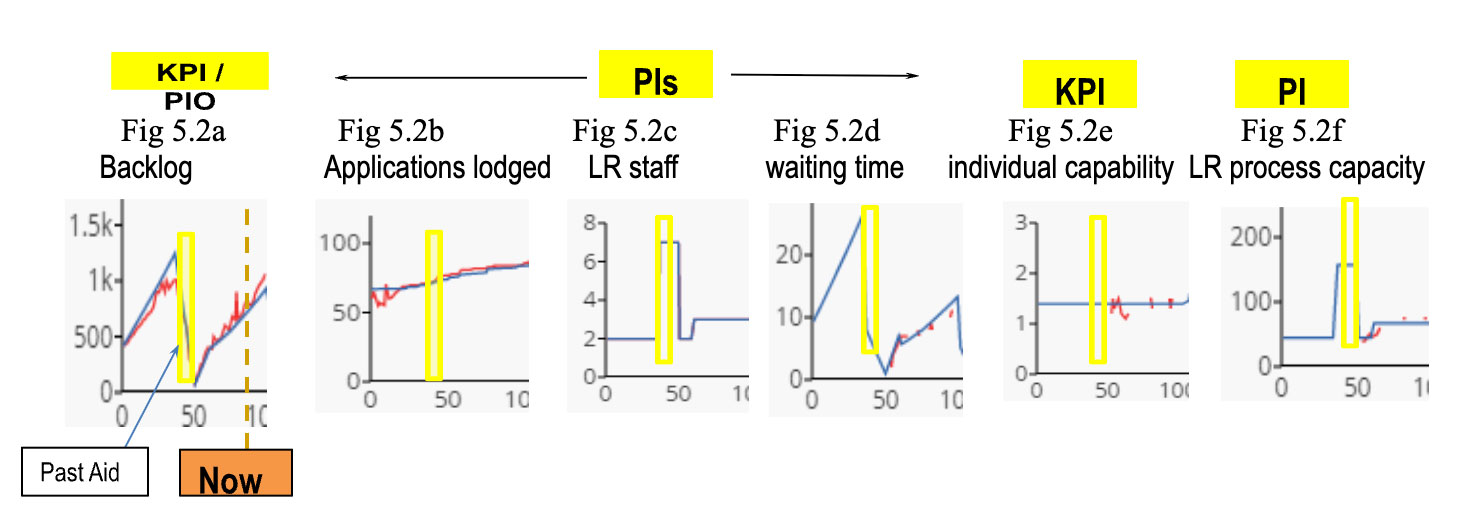
It can be seen that the SD model can reasonably replicate past POT, giving confidence that the model generation of likely future POT will be sufficiently accurate to provide reasonable reliable tests of effectivenessandsustainability of the various PIPs.
WHAT has caused this Past POT?
In Chapter 4, as the SCS was developed, various qualitative observations re POT were drawn. Using the model, quantitative observations can be made.
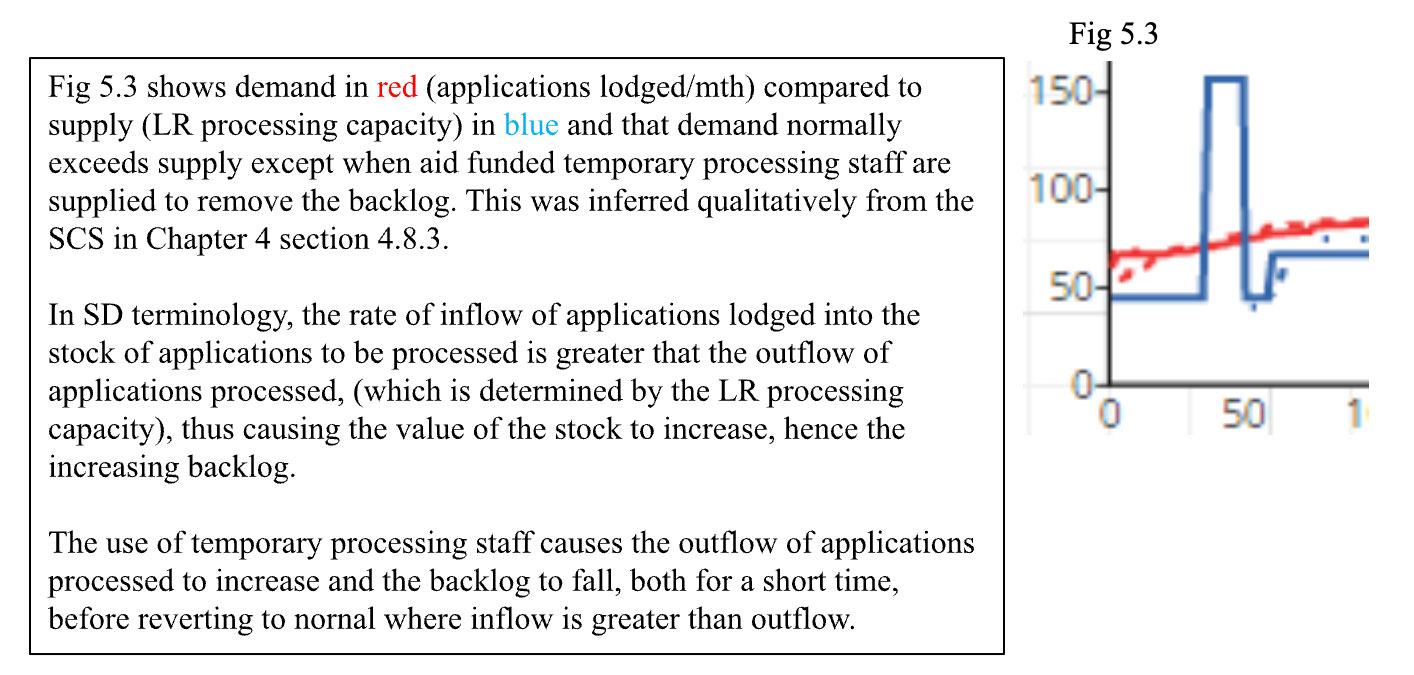
The outflow (applications processed/mth) is low because:-
- Individual productivity/capability is low (~1.4 applications processed/person/day) due to:- cumbersome procedures and workflows; low skill levels
- LR processing capacity is low (~70 applications processed/month) due to:- low individual capability; work days lost (4 work days/person/month) due to cultural and clan responsibilities3
5.3 Testing PIPs for Effectiveness and Sustainabilityand Results Obtained
This is part of step 6 in the SD approach. Testing using SD models is analogous to bench testing and wind tunnel testiing; the aim is to test and learn before committing major investment to implementation. Fig 5.4 is a light hearted illustration.
Fig 5.4

5.3.1 The Test for Efectiveness and Sustaibnability
The test for effectiveness and sustainability is how well do the future POT trajectories from the SD model, for the various PIPs for each of the KPIs/PTIs compare to the desired future POT trajectories depicted in Figs 4.3a and 4.16.
5.3.2 The results from testing the PIPs
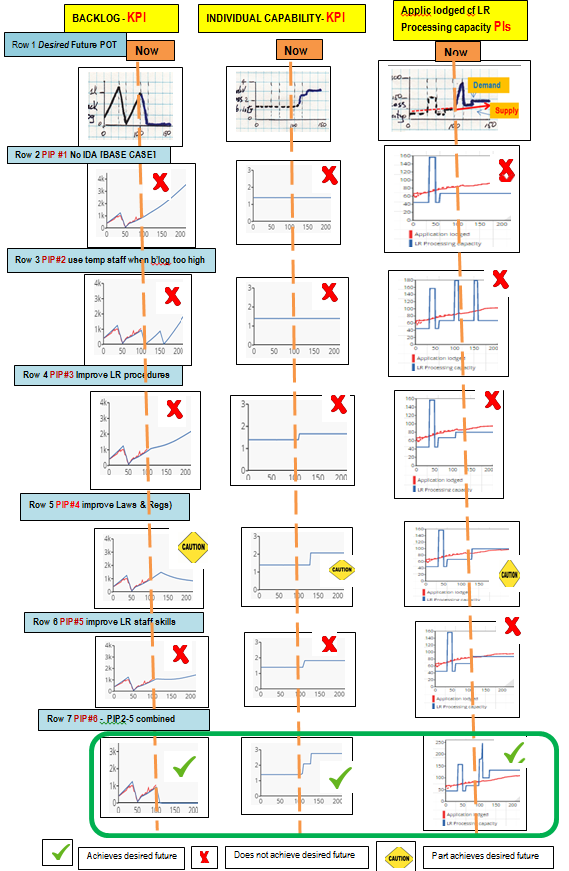
The results from testing the PIPs for effectiveness and sustainability are shown as a series of POT graphs in Fig 5.5. The purpose of Fig 5.5 is to easily compare the effectivenes and sustainability of each PIP against the the desired future POT trajectories of KPIs/PIs that were depicted in Fig 4.16.
Conclusion: PIP#6 (the combination of PIPs#2-5) is the most effective and sustainable. More in Sec 5.3.3.
Fig 5.6 POT graphs for PIs from SD model from testing each PIP for effectiveness and sustainability
Notes on Fig 5.6
- The KPIs/PIs are coumn headings in Fig 5.6, and are are (from left to right):- backlog (KPI/PIO); individual productivity (KPI); Applications lodged (ie demand) compared to LR processing capacity (ie supply) (both are PIs). [
- Row 1 shows the hand sketched past performance and desired future performance graphs of the KPI/PIs column headings listed in #1 immediately above. These graphs were shown in Fig 4.16.
Fig 5.5
- Row 2 on shows the POT trajectories, generated by the SD model, for::- PIP#1-no IDA; PIP#2-continue to use temporary processing staff when backlog reaches a critical level; PIP#3-improve LR procedures; PIP#4-improve laws and regulations; PIP#5-improve LR staff skill levels; PIP#6-a combination of PIP#1-5. The future trajectory is from time NOW, (month 100).
- The units of the horizontal axis are months. Past time is months 0 to 99; previous IDA was provided in months 37-50;current time is month 100; proposed IDA is for months 100 to110; the simulation runs to month 240.
- The units of the vertical axis are: backlog- applications; individual capability-applications processed/ person /day; Applications lodged compared to LR processing capacity - applications/mth
5.3.3 The PIP that is the the most effective and sustainable and WHY
PIP#6 is the most effective because:-
- Its future trajectories (from mth 100 on) (bottom row) align best with the desired future trajectories (top row)
- The backlog is removed using temporary processing staff,
- The procedures in the LR are improved to give greater individual processing productivity (capability); a rise from 1.4 to a target of 2.7 applications processed/person/day
- Increasing the skill level of LR staff further increases individual processing productivity (capability).
- The backlog is kept very low, post IDA (ie improvements are sustainable)
- Supply becomes greater than demand
NB – it is only by modelling that the time based increases in capability and capacity can be determined quatitavely.
The key to sustainability of the improvements, post IDA, is inncreasing individual processing capability by improving procedures and workflows, and raising individual skill levels so that LR capacity (supply) is greater than demand (applications being lodged).
The key assumptions, transparent and quantified, in the SD model are:-
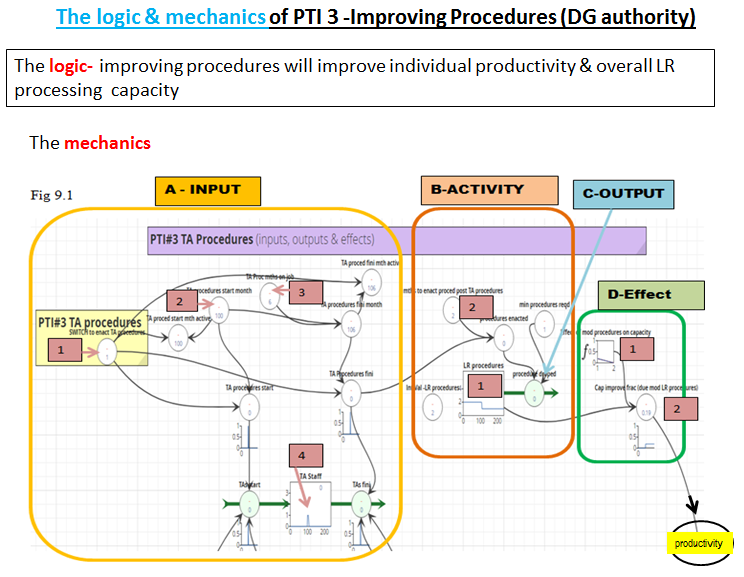
- That improving the LR procedures that are within the authority of the DG of land will bring about an increase of ~20% in individual processing productivity (capability)
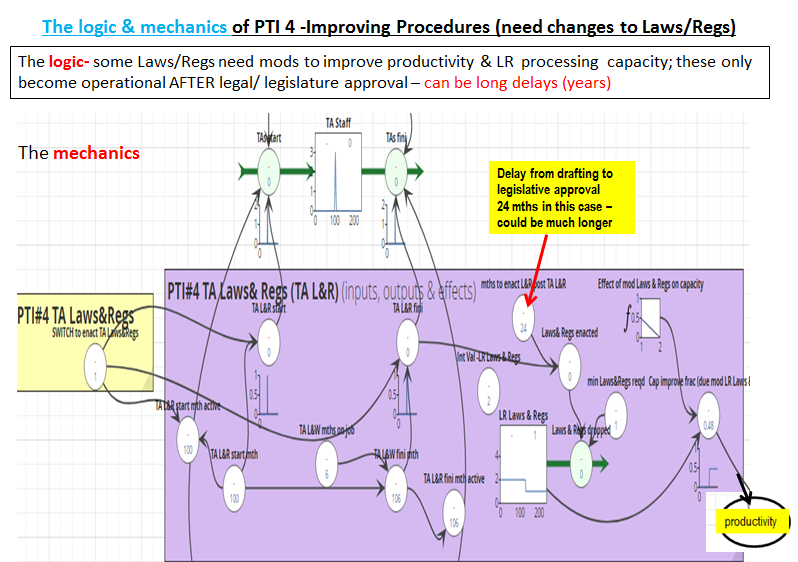
- That improving the Laws & Regs will give an increase of ~50% in individual processing productivity (capability), and that the legislative approval will be achieved by 24 months after the legislation is drafted
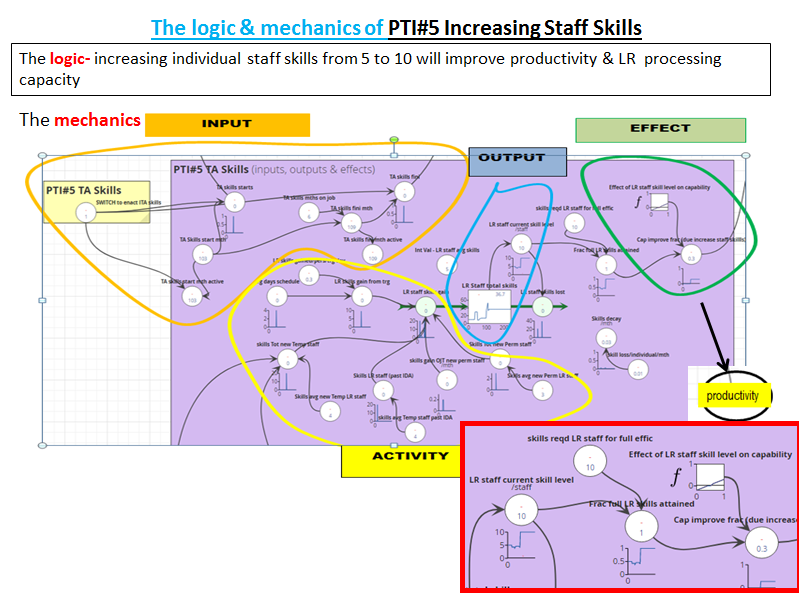
- That increasing the skill levels of individual LR staff will give an increase of ~30% in individual processing productivity (capability)
- That the improvements will “stick” post IDA
5.4 Determining the Improvement Strategy – 1st Pass
This is part of step 6 in the SD approach.
The Strategy for improvement (ie to remove the backlog (with aid) and keep it low (post aid)), should be based on PIP#6 since it has been shown to be the most effectiveness and sustainable, and it aligns with the desired future POT of the performance indicators..
The strategy (with IDA funding) is:-
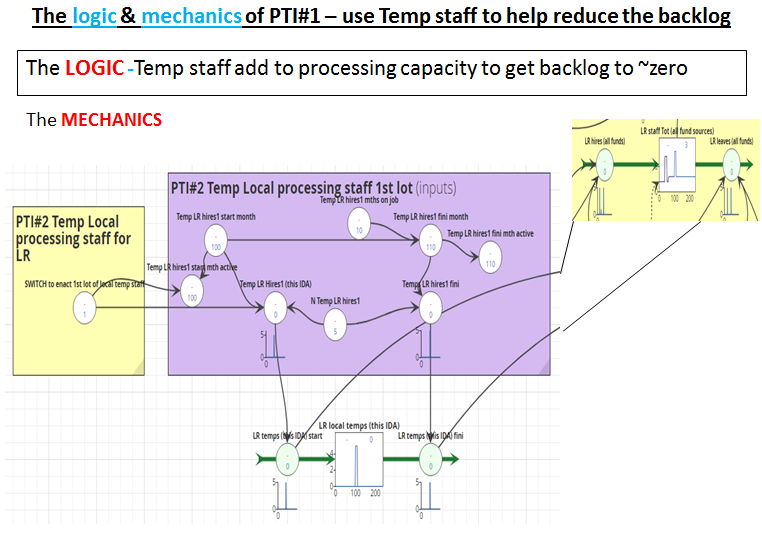
- To employ five temporary local LR processing staff for 10 months to assist the permanent LR staff to remove the backlog
- At the same time as the temporary staff commence, provide two TAs (Technical Advisors) for 6 months each; one for improving procedures without legal changes, the other for improving the Laws & Regulations to provide further improvements in procedures
- Three months after the above TAs commence, another TA commences to focus on improving LR staff skill levels, to develop training material, and to also “to train the trainers”
- For executive management to engage with politicans to “sell” the benefits of changing the legislation
All TAs also have a mentoring role.
The strategy (post aid) is:-
- For LR management to closely monitor the actual trajectories of the KPIs / PIs, compared to the target trajectories, and to carry out corrective action as necessary. This is dealt with more fully in Chapter 7 dealing with M&E (monitoring and evelaution).
- For executive management to continue to engage with politicans to get the necessary legislation changed.
The above improvement strategy is a 1st pass as risk has not yet been considered.
5.5 Risk Identification, What Ifs, Risk Mitigation, 2nd Pass at Improvement Strategy
This section identifies risk, uses the SD model to do some What ifs, and produces a 2nd pass at the improvement strategy.
5.5.1 Risk Identification
Table 5.1 provides a common (simplified) framework used in design to qualitatively identify and examine risk. This framework has been applied to this example of removing the backlog (with aid) and keeping it low (post aid). Only major risks have been listed.
Table 5.1
| Risk | Likelihood | Impact if Occurs | Risk Rating | Mitigation Actions |
|---|---|---|---|---|
| That the desired increase in individual productivity and LR processing capacity is not achieved during the period of aid. | Medium | High to medium, depending on the gap not achieved. | High to medium |
|
| That the increased individual productivity and LR processing capacity achieved with aid is not sustained post aid. | Medium | High to medium, depending on the amount not sustained. | High to medium |
|
| That the backlog will not be removed during the period of aid. | Low | Low to medium, depending on the size of the backlog left. | Low | Ensure the backlog is cleared, even if the employment of temporary processing staff has to be extended. |
H = high; M = medium; L = low
5.5.2 The What Ifs and what they indicate
Having a quantitative SD model allows a numeric evaluation of risks that have been identified or aspects that are wished to be examined in more detail.
The What ifs
Table 5.2 lists the What Ifs. All What Ifs are based on PIP#6 which has been identified as the most effective and sustainable and on which the 1st pass of the improvement strategy has been based. The list is meant to be illustrative and not exhaustive.
Table 5.2
| No. | What If | Detail |
|---|---|---|
| 1 | Do not include PTI #4: Improve Laws and Regulations | This examines the effect of drafting improvements to laws and regulations, where these changes do not become operational because they are not approved by the relevant legislative body. |
| 2 | Change assumptions in PTI #4 | This examines the effect of:
|
| 3 | Increase in applications lodged | This examines the effect of an approximately 20% increase in applications lodged, which occurs approximately five months after the completion of IDA. |
| 4 | What If #3 plus a decrease in working days lost | This examines the effect of:
|
The POTs of the PIs resulting from the What Ifs
Fig 5.7 shows the POTs of the PIs from examining the What Ifs based on PIP#6. A summary is provided in Table 5.3.
Fig 5.7
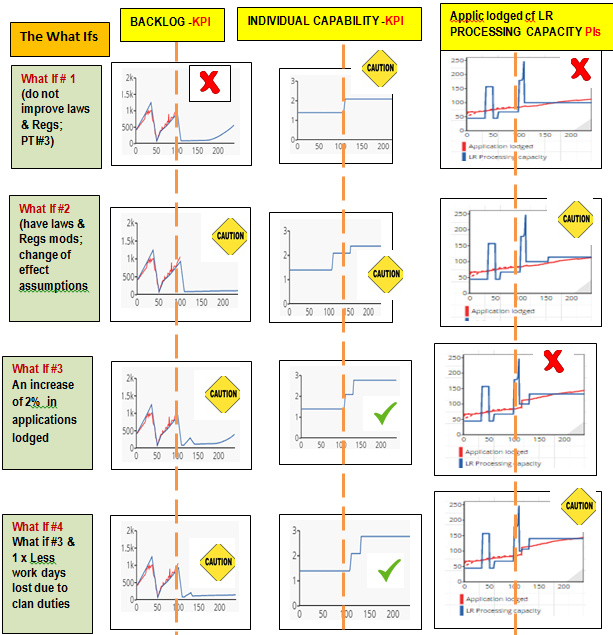
Table 5.3
| No. | What If | Results |
|---|---|---|
| 1 | Do not include PTI #4: Improve Laws and Regulations | The backlog and waiting time will begin to increase approximately six years after project completion, as demand — applications to be processed — becomes consistently greater than supply, which is LR processing capacity. |
| 2 | Change assumptions in PTI #4 | The backlog and waiting time will still remain low, but it will take longer for the full increase in individual capability and LR processing capacity to be reached. |
| 3 | Increase in applications lodged | There will be a small backlog, and it will increase approximately six years after project completion, as demand — applications to be processed — becomes consistently greater than supply, which is LR processing capacity. |
| 4 | What If #3 plus a decrease in working days lost | The backlog and waiting time will remain low. Individual capability and LR processing capacity will increase. |
What the What Ifs indicate
- That it is very important for sustainability that the planned improvements to Laws & Regs be passed into law and become operational, even if it takes longer than planned and does not achieve the full level of improvement envisaged.
- That a significant increase in applications lodged can be handled for some time (~6 years after aid completion), provided that a reasonable level of increase in individual capability is achieved, and sustained.
- That at some point in time, perhaps about 6 years after aid completion, demand will probably be very close to or greater than supply, thus causing the backlog to again slowly increase. It would be prudent for LR management well before then to consider ways to address this. [The use of the SD approach for this is shown as an example in Chapter 9].
The main point is that using the SD approach, any What Ifs can be examined quickly, logically, quantitatively and transparently and any variations to detail in Table 5.3 can be examined.
5.5.3 A 2nd Pass at the improvement strategy
The 1st pass at the improvement strategy was shown in Sec 5.4. The results of examining the What Ifs using the SD model indicate that an additional element should be added to this strategy (with aid) and also post aid. The elements are:-
- With aid – that LR management be couched in routine M&E and how the SD approach can be used post aid as a living business model (example shown in Chapter 7)
- Post aid – LR management to address the mid term future issue of when demand is likely to exceed supply
The 2nd pass at the improvement strategy is at Annex C.
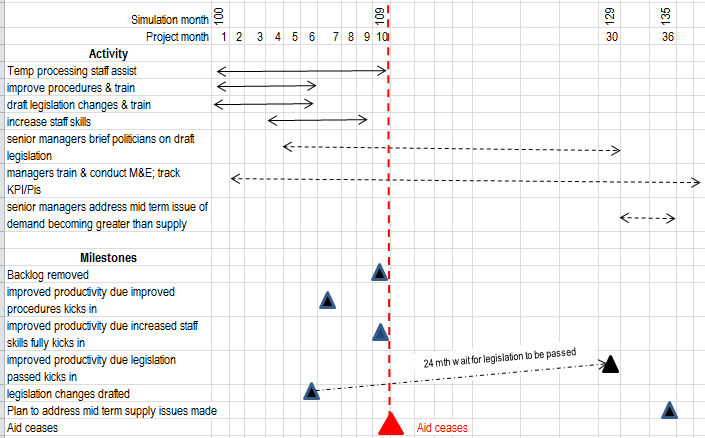
5.6 Gantt Chart – 1st Pass
A 1st pass at a Gantt chart is shown as Fig 5.9. This can be compiled after the improvement strategy has been determined (Sec 5.5.3) and indicative inputs and durations for the PIPs determined (Table 4.3). This can be revised and expanded after the project is evaluated (Chapter 6 refers).
Fig 5.8
5.7 What has been shown in this chapter
This chapter has shown, how the SD model, built using the SCS as a guide, can be used to:-
- Test the PIPs for effectiveness and sustainability and do What ifs
- Determine an improvement strategy
5.8 Some things that could be added to the SD model
The aim of this chapter was to illustrate how any PIP (proposal to improve) could be quantitatively and transparently examined to determine its likely future POT and to ascertain how close it might be to a “desired” future POT trajectory, and thus determine an improvement strategy. The example used for this first illustration was a relatively simple development task, that of removing a processing backlog and keeping it low, post IDA
Some refinements that could be included are:-
- Have no application processing on the days when skills upgrading is being carried out by the short term adviser
- Have a loss of skills over time as an outflow and have a skills inflow if periodic training is provided, post IDA
- Have a reinforcing feedback loop between the level of individual capability and absenteeism. i.e. as individual capability increases, so does pride in ability, morale, a decrease in absenteeism, and a rise in individual productivity
While all these could be added, they would add to the complexity of this first illustrative example, and would be unlikely to lead to any significant changes to the results shown in Fig 5.5.
5.9 Some characteristics of the SD approach
At this stage it is possible to make some preliminary observations on the characteristics of using the SD approach and an SD model to test PIPs for effectiveness and sustainability, they are:-
- The SD approach based in system dynamics handles indirect cause and affect by the use of feedback loops
- The schematic diagram of the core structure of the system to be improved (the SCS) enables an early and easy understanding of the fundamental dynamics of the situation (the backlog in the above example); what is driving what, and why, and what the proposed PIPs will affect, all without recourse to the detail of the model itself
- The SD model allows the likely future POT trajectory of PIs to be numerically estimated for any number of PIPs and quickly allows the PIP that best aligns with a desired future POT trajectory to be determined
- Estimates are quantitative and any number of What Ifs can be quickly run and the results evaluated
- The models are completely transparent; there is no black box; there are no implicit assumptions; the logic, variables and assumptions can be quickly and easily modified.
- While it would be possible to examine PIPs using spreadsheets, it is very much easier (no cell numbering with formulae) using SD software, Silico, especially when the models become more complex
Summation
The big contribution of Strategy Dynamics is that it explains how and why systems generate the changes to performance outcomes that occur over time, and enable bench testing of strategies and policies to make substantial sustained improvements to those outcomes. This is made very clear with performance time-charts. (Warren K 2020).
A “system” view solves the challenge of improving POT, because a SD simulation model enables (Warren K 2009):-
- The Determination if a plan will work at all
- The design of a system so that it can perform well
- The management of a system so that it does perform well
- The fixing of a system if problems occur
This chapter has illustrated points 1 and 2. Points 3 and 4 are covered in Chapter 7. How the SD approach adds value to current approaches is discussed in Chapter 8.
The next chapter shows how an evaluation of the proposed project can be carried out using the SD model.
5.10 Key Points
- Building and using a SD model provides the quantitative dimension and allows numeric and transparent testing of PIPs for effectiveness and sustainability. [While the SCS (schematic of the core structure) provides useful insights into the dynamics of the situation and possibilities for improvement, it is essentially qualitative].
- The SD model also allows any number of What Ifs to be examined quantitatively. From these results an improvement strategy can be determined to address the development task.
References
Warren, K., 2018, Fast and effective living business models with system dynamics: a tutorial on business cases. In Proceedings of the 2018 Winter Simulation Conference (pp. 291-305). IEEE Press.
Warren K (2009), Strategic Management Dynamics, John Wiley & Sons Ltd
Warren K 2020, Personal communications
ANNEX A
A FULL PAGE IMAGE of the SD MODEL
ANNEX B
STRUCTURE of EACH PIP
PIP and PTI are interchangeable
ANNEX C
IMPROVEMENT STRATEGY – 2ND PASS
The strategy (with IDA funding) is:-
- To employ five temporary local LR processing staff for 10 months to assist the permanent LR staff to remove the backlog
- At the same time as the temporary staff commence, provide two TAs (Technical Advisors) for 6 months each; one for improving procedures without legal changes, the other for improving the Laws & Regulations to provide further improvements in procedures
- Three months after the above TAs commence, another TA commences to focus on improving LR staff skill levels, to develop training material, and to also “to train the trainers”
- For executive management to engage with politicans to “sell” the benefits of changing the legislation
- that LR management be couched in routine M&E and how the SD approach can be used post aid as a living business model
All TAs also have a mentoring role.
The strategy (post aid) is:-
- For LR management to closely monitor the actual trajectories of the KPIs / PIs, compared to the target trajectories, and to carry out corrective action as necessary. This is dealt with more fully in Chapter 7 dealing with M&E (monitoring and evelaution).
- For executive management to continue to engage with politicans to get the necessary legislation changed.
- LR management to address the mid term future issue of when demand is likely to exceed supply
ANNEX D
| Abbreviation | Meaning |
|---|---|
| LR | Land Registry |
| KPI | Key Performance Indicator |
| M&E | Monitoring and Evaluation |
| PI | Performance Indicator |
| PIO | Performance Improvement Objective |
| PIP | Performance Improvement Proposal |
| POT | Performance over Time |
| Regs | Regulations |
| SD | Strategy Dynamics |
| SCS | Schematic of the Core Structure |
| TA | Technical Advisor |
Footnotes
- 1 to learn SD model building https://www.sdcourses.com/ ↩
- 2 PIPs are sometimes referred to as PTI (proposals to improve) or PTIP (proposals to improve performance). They are used interchangeably. ↩
- 3 When considering PTIs in Chapter 4 seeking to reduce work days lost due to clan duties was deferred to a later time ↩