CHAPTER 4
STRATEGY DYNAMICS – The PRINCIPLES and applying them
to Remove a Processing Backlog in a Land Registry and Keep it Low
4.0 Introduction
4.1 Strategy Dynamics and Performance
4.1.1 Strategy Dynamics in a nutshell
4.1.2 Strategy and Performance
4.2 The Principles of Strategy Dynamics (SD) and Steps in the SD Approach
4.2.1 The Principles of Strategy Dynamics
4.2.2 The Steps in the SD Approach
4.3 The Use of Illustrative Examples
4.4 Principle #1- Explain and ImprovePerformance Over Time (POT)
4.4.1 POT in general and for the illustrative backlog example
4.4.2 POTs – for IDA task of removing a processing backlog in a LR and keeping it low, post IDA
4.4.3 The importance of a LR, and keeping the backlog low
4.5 Principle #2 - Performance depends on Stocks at every point in time
4.5.1 Stocks and their depiction
4.5.2 How Performance depends on the value of the stock at every point in time
4.6 Principle #3 - Stocks accumulate and deplete over time, driven by flow rates
4.6.1 The bathtub analogy
4.6.2 How stocks accumulate and deplete
4.6.3 How Titleholders accumulate and deplete
4.6.4 How Staff accumulate and deplete
4.6.5 Linking Demand and Supply
4.7 Principle #4 - Flow rates are driven by existing stocks, causing feedback, and areaffected by delays, external factors and internal organisational decisions
4.7.1 Feedback and delays
4.7.2 Decisions
4.8 A SCS (Schematic of Core Structure) of the System whose Performance is to be Improved
4.8.1 A 1st Pass of the SCS where Performance is to be improved
4.8.2 Identification of other PIs (Performance Indicators), their POT graphs and inclusion in the SCS
4.8.3 Observations that can be made at this stage from the SCS, and the POT graphs of the PIs re the dynamics of the system
4.9 Possible “DECISIONS” by LR Management to achieve the PIO (performance improvement objective)
4.9.1 Performance Improvement Proposals (PIPs) – a 1st Pass
4.10 A 2nd pass at the SCS
4.10.1 KPIs and PIs (key and performance indicators)
4.10.2 POTs of the KPIs and PIs
4.10.3 Indicative shapes of “effects of…. on ……”
4.10.4 Observations that can be drawn from the 2nd pass at the SCS (Fig 4.15f) and Fig 4.16 and Fig 4.17a,b
4.11 Key Points
Tables
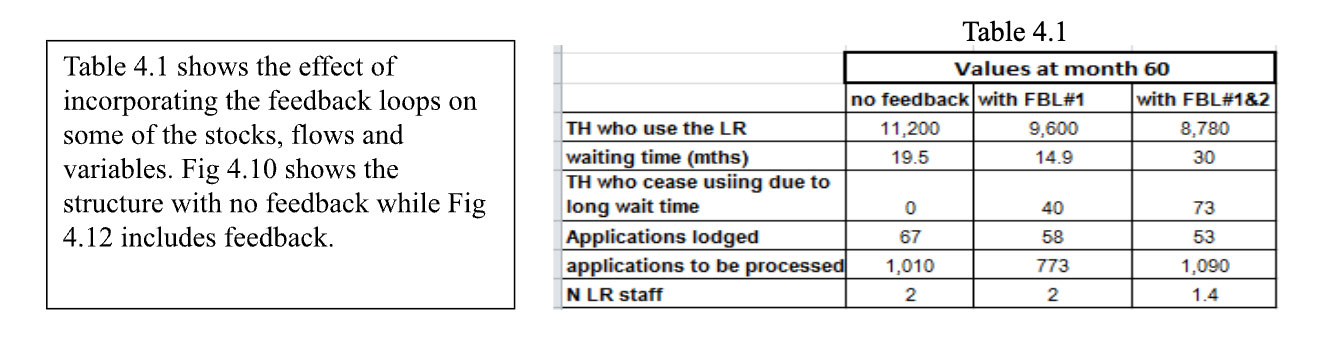
4.1 The effect of incorporating the feedback loops on some of the stocks, flows and variables
4.2 List of PIPs
4.3 A 1st pass at PIP inputs
4.4 PIs and their units
Figures
4.1 Past POT for backlog in a land registry (LR)
4.2 Generic POT diagram for past, desired future, and feared future
4.3a desired future POT for backlog in a LR
4.3b feared future1 POT no IDA for backlog in a LR
4.3c feared future2 POT same IDA as previously for backlog in a LR
4.4a Stock Titleholders who use the LR
4.4b Stock LR Staff
4.5a Applications generated
4.5b LR processing capacity
4.6 Bathtub analogy
4.7a Stock & flow diagram
4.7b Stock & flow diagram with values
4.7c Table of values
4.8a Stocks and flows- Titleholders from subdivision
4.8b Stocks and flows- Titleholders from IRR
4.9 Stocks and flows- staff hires and leavings
4.10 image of SD model – no feedback loops
4.11 image of SD model – with one feedback loop
4.12 image of SD model – with all feedback loops
4.13a feedback loop #1
4.13b graphical function
4.13c look up table
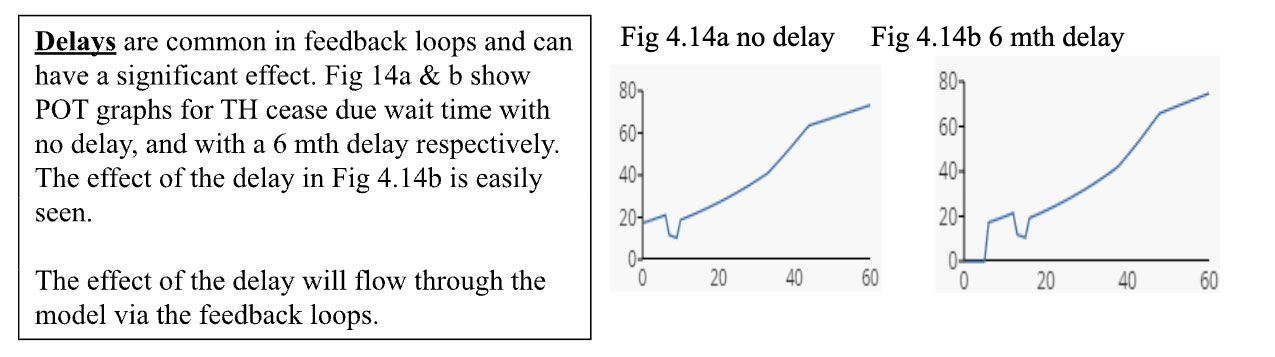
4.14a effect of graphical function – no delay
4.14b effect of graphical function – 6 month delay
4.15a SCS - demand
4.15b SCS – supply servicing demand
4.15c SCS – supply
4.15d SCS – with feedback loops
4.15e SCS – with PIPs
4.15f SCS – with KPIs and PIs
4.16 POTs of KPIs and PIs
4.17a Form of graphical functions for three feedback oops
4.17b Form of graphical functions for effect of PIPs on individual productivity
Annexes
- WHY, WHY, WHY diagram
- Some names and units for resources (stocks) in LA, and names and units for inflows and outflows
C. Some Information on PIs (Performance Indicator)
D. PIPs from Brainstorming
E. First pass –IDA inputs, durations, quantum of improvement hoped for
F. SCS (schematic of core structure) of each PIP
G. A Consolidated list of observations from the SCS and associated data
H Abbreviations used
CHAPTER 4
STRATEGY DYNAMICS – The PRINCIPLES and applying them
to Remove a Processing Backlog in a Land Registry and Keep it Low
4.0 Introduction
Chapter 3 indicated where the system of Land Administration (LA) fits into the IDA (International Development Assistance) development logic, and how feedback loops affect project outputs and impacts.
The central theme of this booklet is that, by using the Strategy Dynamics (SD) approach, it is possible to test for effectiveness and sustainability,any Performance Improvement Proposals (PIP) in land administration (LA), during IDA project design and before large investment $ are committed.
The purpose of this chapter is to: -
- Outline what Strategy Dynamics (SD) is and what it can do
- List the principles of SD
- Illustrate applying the principles with a simple example from LA, that of removing a backlog in a LR (Land Registry) and keeping it low, post IDA
- Produce a SCS (Schematic of the Core Structure) that illustrates the system and the dynamics of processing applications in the LR, together with the PIPs
It is not the purpose to provide a user guide1 to Strategic Dynamics or the Sysdea software, now Sheetless.
Acknowledgement: - This chapter draws heavily on Dr Kim Warren’s ideas, methodology and materials for Strategy Dynamics, Warren K (2009, 2010), and modelling software, Silico2; The backlog in the LR draws upon elements in Warren’s learning model of the IT Support Company. This is gratefully acknowledged, as are his many helpful comments. However, all errors are the authors.
4.1 Strategy Dynamics and Performance
4.1.1 Strategy Dynamics in a nutshell
The SD approach, and its associated software, Sysdea, allows time based, quantified and transparent simulation models to be built showing how organisations, and the issues they face, actually functionand perform over time (POT). This makes it possible to work out what to do on all key decisions across a business, and to continually update those insights as circumstances change. Past POT can be replicated, and likely future POTs generated.
A system view solves the challenge of improving POT because a SD simulation model enables (Warren K 2009):-
- The Determination if a plan will work at all
- The design of a system so that it can perform well
- The management of a system so that it does perform well
- The fixing of a system if problems occur
Strategy Dynamics is the application of the generic mainstream method of system dynamics3 to strategy questions.
The big contribution of Strategy Dynamics is that it explains how and why systems generate the changes to performance outcomes that occur over time, and enables bench testing of strategies and policies to make substantial sustained improvements to those outcomes. This is made very clear with POT (performance overtime) charts. (Sec 4.3 refers).
4.1.2 Strategy and Performance
An organisation’s strategy is how it tries to reach its objectives. The objectives may be financial (e.g. profit) or non-financial (e.g. customer numbers). In LA objectives could be: -processing applications in a LR to take no longer than x weeks; a certain $ amount of fees to be collected annually by a LR; a certain % of land/property owners to have a formal title.
Strategic management is about building and sustaining performance into the future, and this is essentially what IDA seeks to achieve.
Performance over Time (POT) is of major importance. The performance in question can be an objective, or a PI (Performance Indicator) that the organisation is trying to meet or improve.
4.2 The Principles of Strategy Dynamics (SD) and Steps in the SD Approach
4.2.1 The Principles of Strategy Dynamics
In Chapter 3, Sec 3.5 the characteristics of systems were listed, together with their consequences and some examples from LA. This section lists and illustrates the principles that underpin SD. The illustrations will use as an example IDA task of removing a long term application processing backlog in a LR, with IDA, and keeping it low, post IDA.
The following four principles underpin SD: -
- Explain and improve the performanceover time (POT) of a system
- Performance depends on stocks (the assets of an organisation), at every point in time
- Stocks accumulate and deplete over time, driven by the flow rates into and out of the stocks
- Flow rates are driven by existing stocks (causing feedback and delays), external factors and internal organisational decisions
These will be explained in the following sections.
4.2.2 The Steps in the SD Approach
The following are the steps in the SD approach which will be followed in this booklet. They can be considered under the headings as shown.
Design a system so that it can perform well
- Establish the PIO (performance improvement objective(s)), with and without aid
- Draw POT graphs (performance over time) showing past, desired future, feared future trajectories for the PIOs; also compile a Why, Why, Why4 (root cause) diagram and draw some preliminary conclusions re the dynamics in play.
- Establish the system to be improved and sketch a SCS (schematic of the core structure) of the system
- List PIPs (performance improvement proposals) with indicative inputs and durations
- Build a SD model of the system and show that it can replicate past POT
- Test the PIPs for effectiveness and sustainability, using the SD model, and identify an improvement strategy
- Do financial and non-financial evaluation
Manage the system to perform well and fix problems as they arise
- Identify KPIs and PIs (key and performance indicators) of the system
- Collect data on KPIs/PIs and compare actual to model data
- Determine revised performance targets for one or more KPIs and calculate revised performance targets for dependent KPIs/PIs
- Managers determine actions to be carried out
- Repeat cycle 8-11 regularly
4.3 The Use of Illustrative Examples
This booklet explains the use of the SD approach by using a number of illustrative examples of common situations in LA in developing economies. NB – these are all hypothetical examples and do not relate to any real situation. This first example is a simple one that is a processing backlog in a land registry (LR). More complex examples are shown in later chapters. The story line for the backlog follows.
• Setting – A small regional LR in small island country of 3 processing staff; [there are quite a number of “lands officers” who deal with approvals before documentation reaches the LR
• The Situation 5 years ago - aid of 5 temporary staff for 14mths was provided to successfully remove a backlog of 1,000 applications (~ 20 mth backlog)
• The Situation now - the backlog is back up to ~1,000; the in country Finance Department has indicated it will not consider funding an additional position until the LR can demonstrate some sustained improvement. Aid has again been requested to remove the backlog.
The PIO(Performance Improvement Objective) isto remove the backlog (with aid), and for the backlog to remain low (i.e. be sustainable) post aid.(This is step 1 in the SD approach).
4.4 Principle #1- Explain and Improve Performance Over Time (POT)
4.4.1 POT in general and for the illustrative backlog example
In IDA for LA, an improvement in POT is sought from the IDA investment. This is not fundamentally different from any enterprise (e.g. a private company, a not-for-profit, a government agency) which seeks, by selected investment, to achieve certain objectives, and improve their POT.
Fig 4.1 illustrates a POT graph of past performance in an LR for the Performance Indicator (PI), backlog, (applications waiting to be processed at the end of each month). This POT is for the illustrative backlog example outlined in Sec 4.3.
Fig 4.1
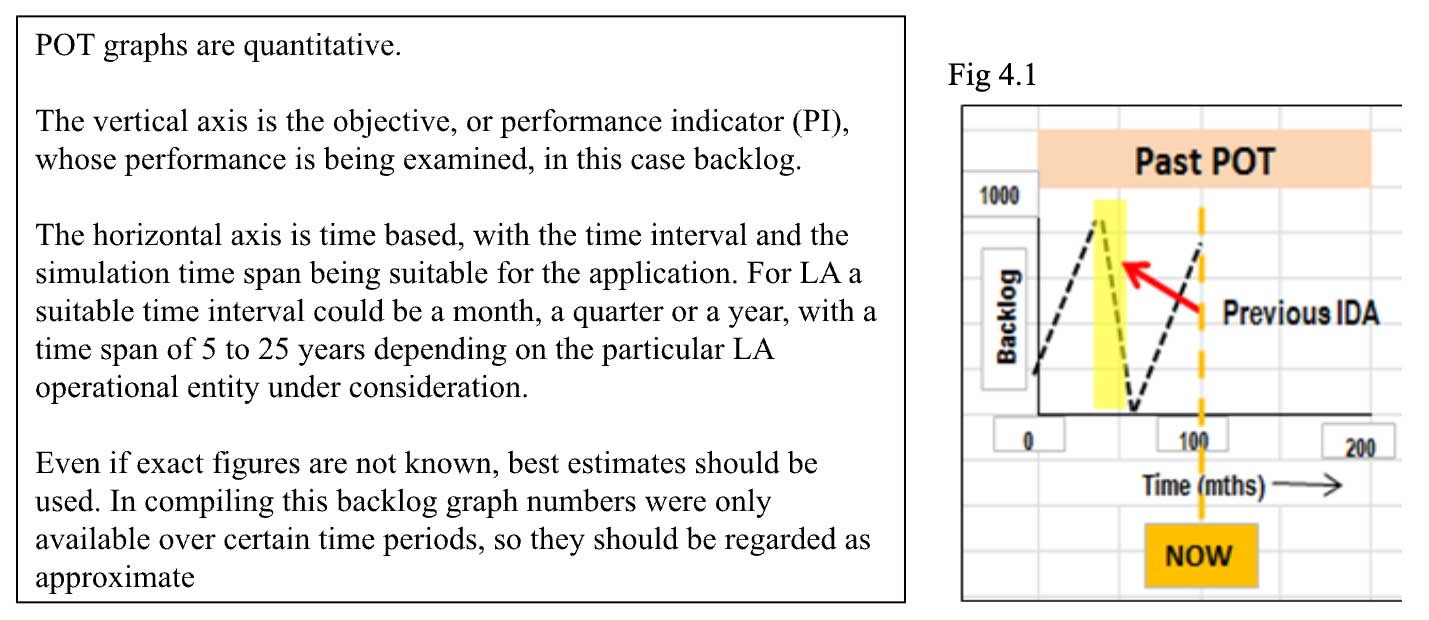
The yellow shaded area of Fig 4.1 is where the previous IDA was
The yellow shaded area of Fig 4.1 is where the previous IDA was used (months ~40-54) to remove the backlog. However, the backlog has again increased up to the NOW point in time (~month 100).
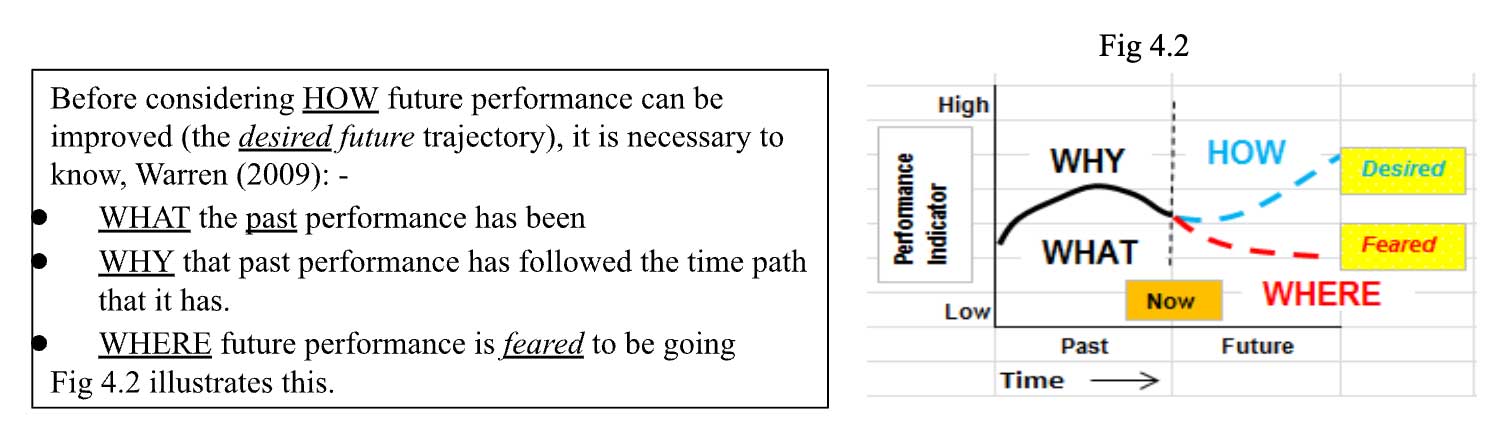
Fig 4.2
WHAT the past performance has been for the backlog example is shown in Fig 4.1from months 0 to 100.
In seeking to explain WHY the past performance has followed the time path that it has in Fig 4.1, the following has been found useful:-
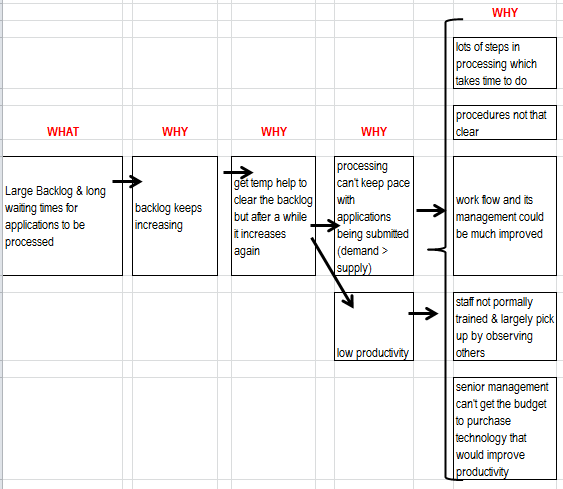
- Compile a WHY, WHY, WHY (root cause) diagram as shown at Annex A and draw observations re the dynamics in play. (This can be done as part of a brainstorming session during design with local team members)
- Update observations after the compilation of the SCS (see Sec 4.9)
- Update after using the SD model (Chapter 5 Sec 5.2 refers)
What the WHY, WHY, WHY diagram (Annex A) indicates: -
- That demand (applications for processing) is greater than supply (capacity of the LR to process)
- Processing capacity is low because: - productivity is low (low skills; process & workflows unclear and cumbersome); budgets are insufficient for adequate maintenance and technology)
4.4.2 POTs for the IDA task of removing a processing backlog in an LR and keeping it low, post IDA
This section shows the POT graphs for backlog which is step 2 of the SD approach.
- Fig 4.1 showed the POT for past performance.
- Fig 4.3a indicates the desired future POT (the blue line) where the backlog is removed and remains low, post IDA.
- Fig 4.3b indicates feared future 1 POT (the red line) if no IDA is provided, i.e. the backlog continues to increase.
- Fig 4.3c indicates an alternative feared future 2 POT (the red line) if the same type of IDA, temporary processing staff, is again provided. i.e. the backlog will be removed but will increase again once IDA ceases. When the backlog again reaches some critical level, IDA will again be requested to fund temporary staff to again remove the backlog. (An oscillation occurs; this is called the fix that fails in system dynamics).
Fig 4.3a Fig 4.3b Fig 4.3c
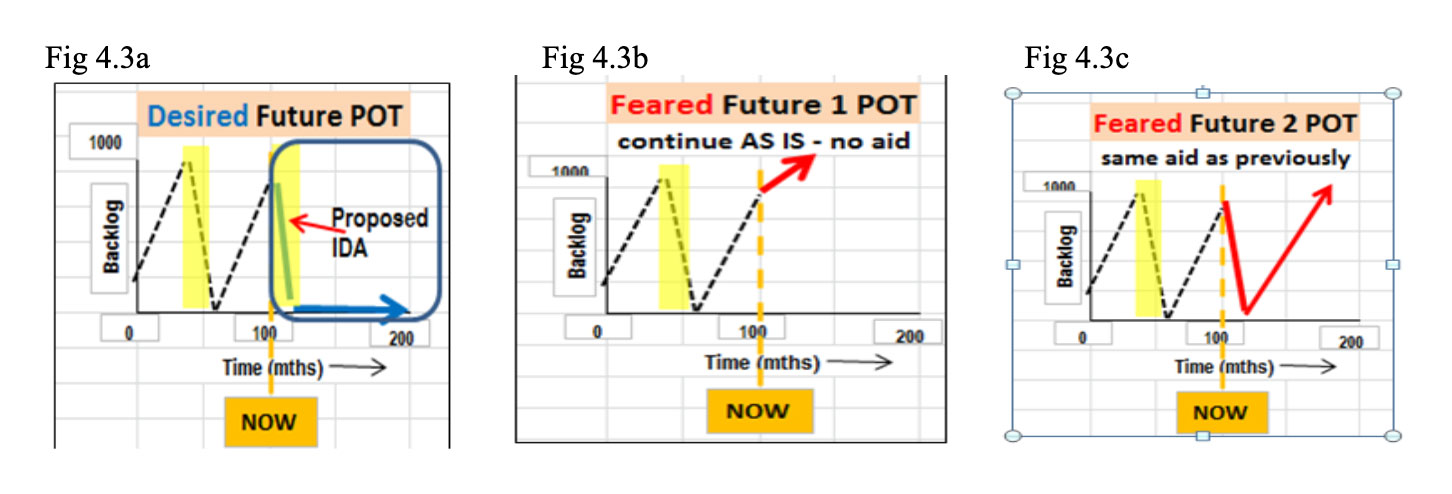
In practice the POT lines would not be straight as illustrated but rather more curved.
The need is to determine an improvementstrategy that will result in the desired future POT illustrated in Fig 4.3a.
Here POT graphs are only introduced. Fully explaining past POT and determining HOW to improve future POT relies on the next three SD principles.
Before that, the importance of an LR and having a low backlog is indicated.
4.4.3 The importance of a Land Registry (LR), and of keeping the processing backlog low
The importance of an LR
A Land Registry (LR) is a core LA operational entity. Its strategic position was shown in Fig 2.1.
The LR is fundamentally important in its own right because: –
- It is (in developed economies) the authoritative source of all5 rights and interests in land/property at any point in time
- It provides legal documentation and information pertaining to those rights and interests
- In records all changes in rights and interests
- It acts as a collector for government fees and taxes on property dealings (generally a significant revenue stream to government)
- The authoritativeness on the rights and interests in property held by the LR are held in high confidence by the community, accepted legally, and thus contributes to minimising disputes over property (thus fostering social stability), and allows lenders (e.g. banks) to provide development capital by accepting the title to property as collateral, and not charging exorbitant interest rates.
The LR is very important as a base building block for other upstream LA operational entities as: –
- LR records, when integrated with land parcel boundary ownership data, forms the base layers of a Land Information System (LIS), which can be used by all the other LA operational entities
- All other operational entities can "overlay" their geo referenced data to the property base layers of the LIS
- Can save upstream operational entities considerable establishment and maintenance costs by sourcing property LIS from the LR
The importance of LR and its data can be gauged by looking at what happens when the LR is not highly effective nor its records authoritative: –
- Land/property disputes can be very difficult to resolve and are likely to increase
- No or little long-term lending, using a title as collateral occurs, thus reducing the major source of development capital to property owners
- The agencies responsible for upstream LA operational entities incur greater establishments and operating costs in establishing their own silos of property information which can quickly become outdated
The importance of a LR was made by English et al (2019) when reporting on lessons and guiding principles from DFID (UK) land sector support programs. They noted, “without an accurate, well-run and transparent land registry, local and national governments cannot approve and register legally secure land-rights transfers through sale, inheritance or gift”.
The importance of keeping the LR processing backlog low
A large long term LR processing backlog in developing economies, and concurrent long customer waiting times for LR staff to process applications can lead to a number of adverse effects e.g.: -.
- Titleholders avoid using the LR for their property dealings
- The payment of informal fees to “speed up” LR processing
- A lessening of public trust in the LR
The basis of a downward spiral (a reinforcing feedback loop) is thus established. Hence, it is very important for IDA, not just to remove the backlog, but also to endeavour to ensure the backlog remains low, post IDA.
While removing the backlog with IDA assistance can easily be done, using temporary processing staff, keeping the backlog low post IDA i.e. (achieving sustainability), can be a little more difficult (Fig 4.3b, c refers). Annex D of Chapter 2 illustrated typical (large) gaps between feared and future POTs for a number of LR performance indicators. Annex E of Chapter 2 showed that removing a backlog in an LR is only one of a number of tasks that may be necessary to improve the operations and quality of an LR and to increase its efficiency and effectiveness.
Achieving sustainability post IDA by keeping the backlog low, would be a good indicator that further IDA to further improve LR operations could be effective.
The next three sections explain the remaining SD principles and then apply them to the backlog example.
4.5 Principle #2 - Performance depends on Stocks at every point in time
In Sections 4.5, 4.6 and 4.7 the SD principles are illustrated by building up a small SD model. This model has the setting of processing applications in a LR,but the structure and numbers have been kept simple, hence it is not the same as depicted by the POT in Fig 4.1.The illustrative backlog example of Sec 4.3 and its POT in Fig 4.1 will be picked up again in Sec 4.9 where the four SD principles will all be applied to it.
4.5.1 Stocks and their depiction
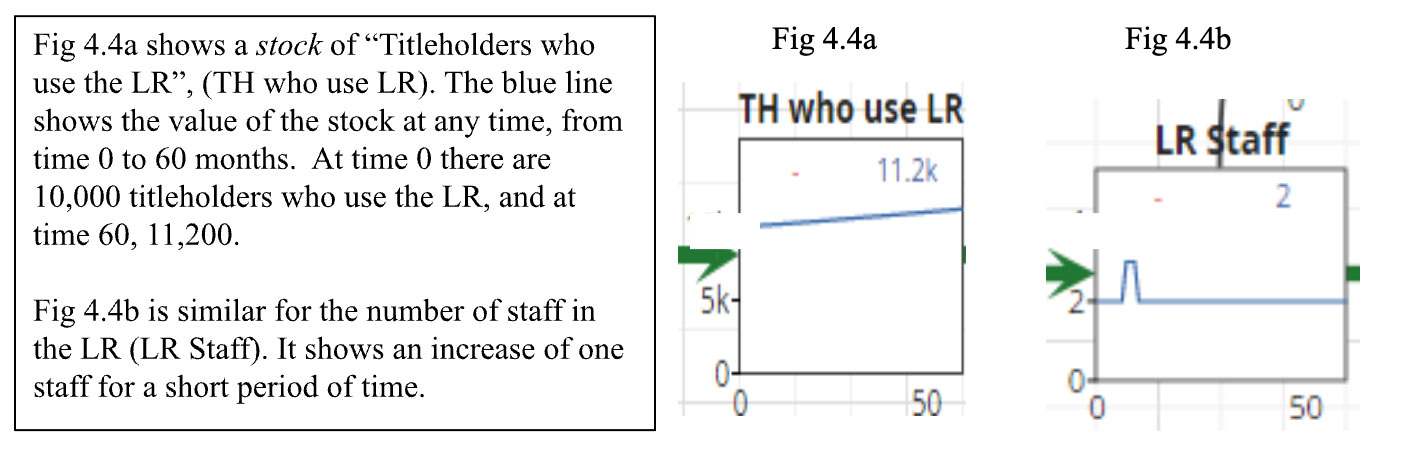
Stocks (a technical term in system dynamics) are the resources or assets of an organisation. These assets may be tangible (can be seen, bought, sold, counted) such as staff, equipment, products, capacity, etc. and intangible (soft factors) such as morale, pressure, reputation, knowledge etc. Assets can have “attributes”, qualities of the resource, such as staff skills, staff experience, customer value, product functionality etc. A stock is depicted6 as a box (Fig 4.4a), and this can be considered as a reservoir which holds the asset
In LAtangible assets can be such as titles, titleholders who use the LR, permanent LR staff, temporary IDA funded personnel employed to assist with a once off improvement task, viz remove a processing backlog, conduct initial recording of property rights (IRPR), improve the operations of a LR.
Intangible assets can be morale of LR staff, level of public trust/reputation in the LR, propensity to charge informal fees. Attributes can be such as staff capabilities, quality, coverage of LR records.
In this backlog example only tangible assets (Titleholders, staff, applications) are used. In the second illustrative example (Chapter 9), intangible attributes of quality and reputation are included. In Chapter 10, the third illustrative example, intangible attributes of skills and morale are included.
4.5.2 How Performance depends on the value of the stock at every point in time
Fig 4.5a Fig 4.5b
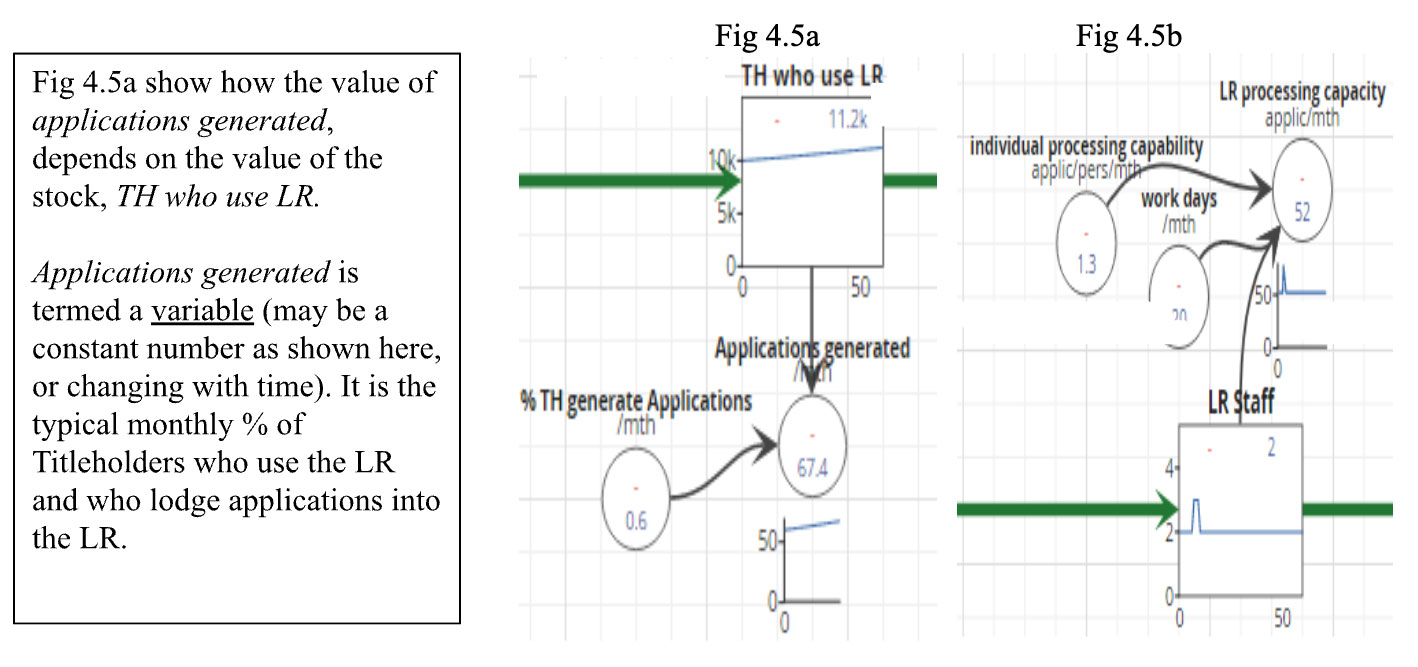
In Fig 4.5a it can be seen that the value of applications generated varies at every point in time from about 60 to 70. The formula is Applications generated = TH who use LR x % TH generate Applications
Similarly in Fig 4.5b a value is calculated for LR processing capacity [= individual processing capability x effective workdays x LR staff]. It can be seen that the LR processing capacity increases with the short term increase in the stock, LR staff.
Summary - If the value of the Stock changes (e.g. Titleholderswho use the LR, LR Staff, (or any of the associated variables) then the calculated values of applications generated, or LR processing capacity will respectively also change. [Principle #2].
4.6 Principle #3 - Stocks accumulate and deplete overtime, driven by flow rates
4.6.1 The bathtub analogy
Fig 4.6
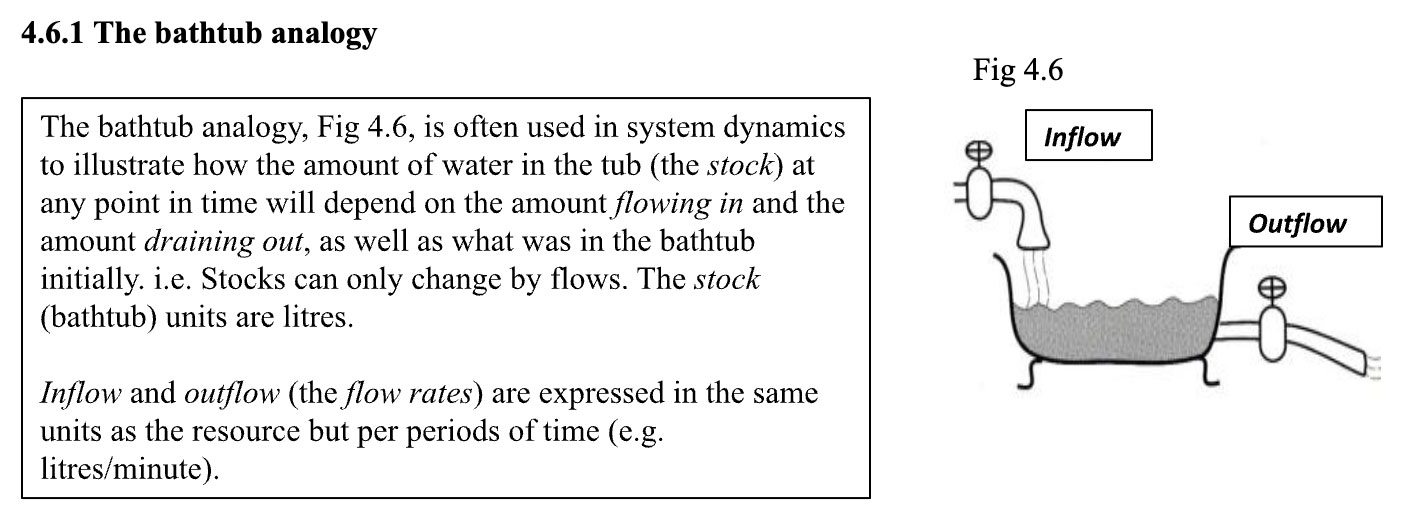
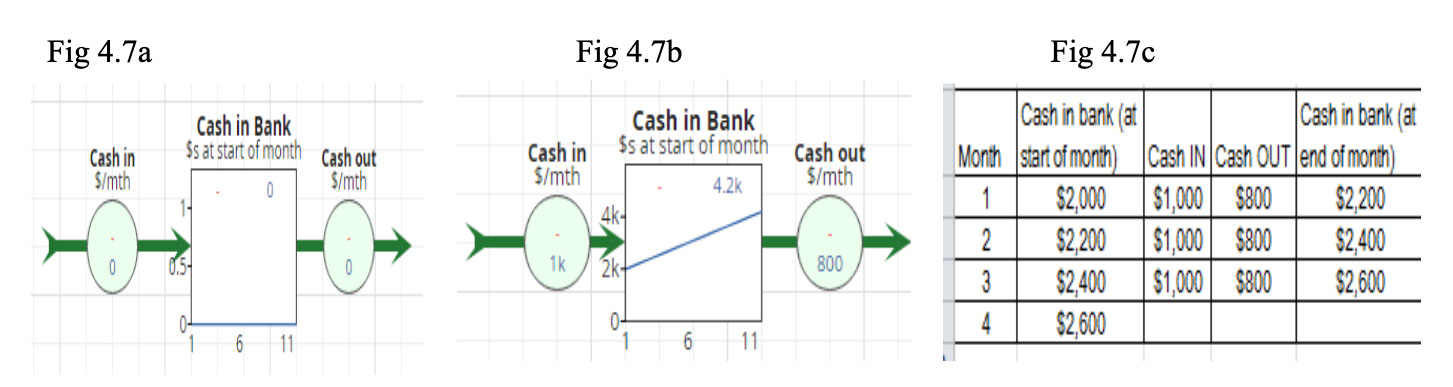
4.6.2 How stocks accumulate and deplete
Fig 4.7a is termed a stocks and flow diagram. It shows the SD symbols corresponding to the bathtub analogy of Fig 4.6. The stock is Cash in Bank (in $s), the inflow on the left hand side is Cash in (in $/mth), the outflow on the right hand side is Cash out ($/mth). The simulation period is from months 1 to 12.
Fig 4.7b shows Cash at the bank at the beginning of each month when starting Month 1 with $2000 in the bank, and with Cash in of $1000/mth and Cash out of $800/mth. The Cash at the bank at the beginning of each month is shown by the blue line in the stock.
Fig 4.7c shows, in spread sheet form, the relevant calculations.
- At start of month 1 there is $2000 in the bank
- At start of month there is in the bank $2,200 [=$2000 (start mth 1) + $1000 (cash in) - $800 (cash out)]
- And so on for other months
NB – The calculations SD does are no different to those done in a spreadsheet. Every link is a set of cell references; every object holds a formula just like a spreadsheet except the formula is in natural language not A$12 * $B$3. The great value of SD is: -
- The graphical building blocks/symbols and layout (linkages) to build and show the transparent logic,
- The ability to embed the relevant formula,
- The integral POT graphs show what is happening over time.
4.6.3 How Titleholders accumulate and deplete
Figs 4.8a and b shows Fig 4.5a expanded to include an inflow and outflow.
The inflow, New TH who use LR, can come from two sources; from new Titleholders created through subdivision and new titleholders from initial property rights recording.
The outflow, TH ceased, can come from two sources; Titleholders ceased due to subdivision and titleholders who cease using the LR7 due to the long waiting times for processing at the LR8.
Fig 4.8a show only an inflow of 19- 25 new TH/mth, with an outflow of 2 titles ceased/mth. This give rise to an accumulation in the stock, TH who use LR, from10,000 titles at the beginning to 11,200 at month 60.
Fig 4.8b builds on Fig 4.8a by including an inflow of Titleholders from Initial Rights Recording (assuming such a program was underway). This shows an initial inflow of ~200 new titleholders/mth, starting about month 24, and rising to ~400 /mth by month 60. It can be seen that the number of Titleholders who use the LR has increased about two fold, and the number of applicationsgenerated has also increased significantly. The LR would need to be prepared to handle this significant influx of new titleholders and the subsequent work generated. This is examined briefly in Chapter 9 and more fully in a later chapter.
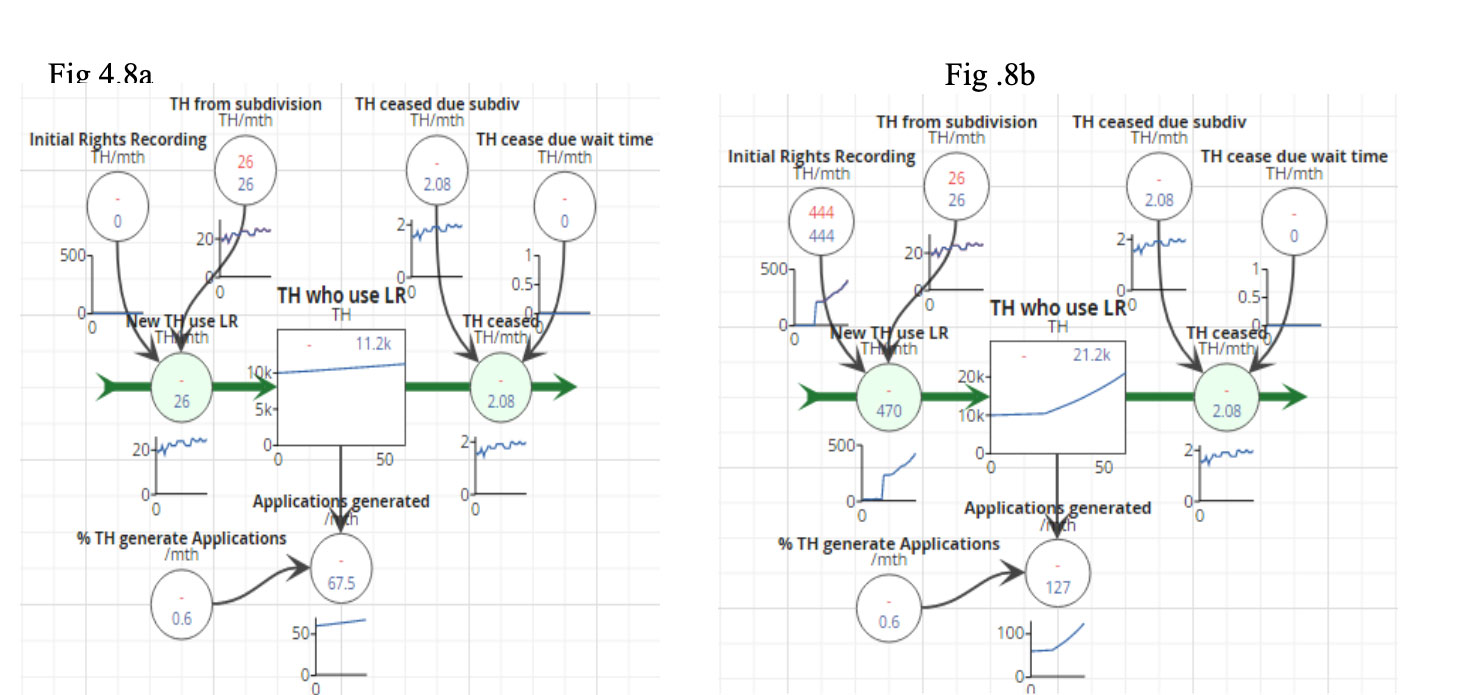
Fig 4.8 portrays DEMAND, the lodgment of applications from LR customers to be processed by the LR.
4.6.4 How Staff accumulate and deplete
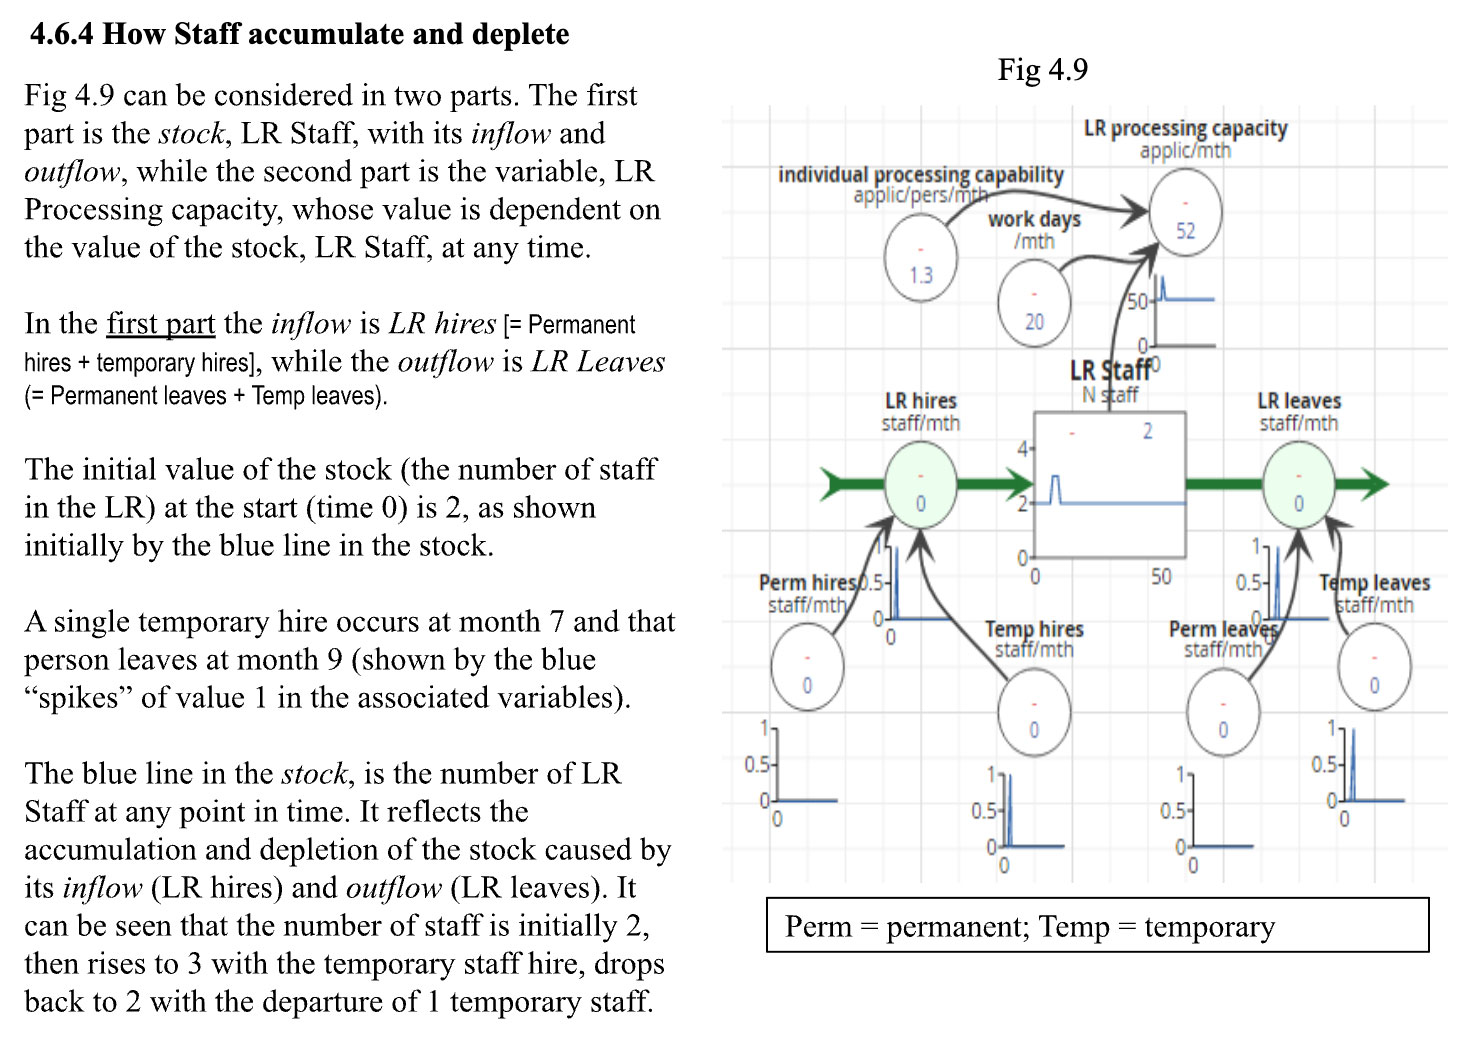
The second part is the calculation of LR processing capacity9 [=LR staff x workdays x individual processing capability10 x LR staff]. In Fig 4.9 the small graph beside the variable, LR processing capacity, shows the number of applications processed/mth by the LR as a whole, over the 60 months. This is a POT graph. The number of applications processed/mth varies from ~50 to ~80 at different points in time, largely dependent of the value of the stock, the number of staff in the LR at the same point in time. (Fig 4.5a, b and the associated text refer).
Fig 4.9 portrays SUPPLY, the provision of processing capacity by the LR staff. Annex B lists for LA some names and units for resources (stocks), and names and units for associated inflows and outflows.
Summary- The level of a resource (and hence a performance objective) at any point in time, is totally and exclusively explained by the stock’s (assets) history of inflows (gains) and outflows (losses).[Principle #3]
4.6.5 Linking Demand and Supply
Fig 4.8a depicts DEMAND, applications submitted to the LR for processing, while Fig 4.9 depicts SUPPLY, the capacity of the LR to process submitted applications. The ideal situation is where SUPPLY is just greater than DEMAND so that backlogs and waiting times are very short, and customers are happy. In this illustrative case, the situation is that there is a large backlog and long waiting times, a not uncommon situation in developing economies (see Section for Registering a Property in World Bank Doing Business scores http://www.doingbusiness.org/en/data/doing-business-score?topic=registering-property )
A step in building the dynamics of the system is to link demand and supply in the SD model. Fig 4.10 shows the linkage of Figs 4.8a and Fig 4.9 with some additions. The addition is a section call Supply servicing Demand highlighted in red in the middle of Fig 4.10.
Fig 4.10
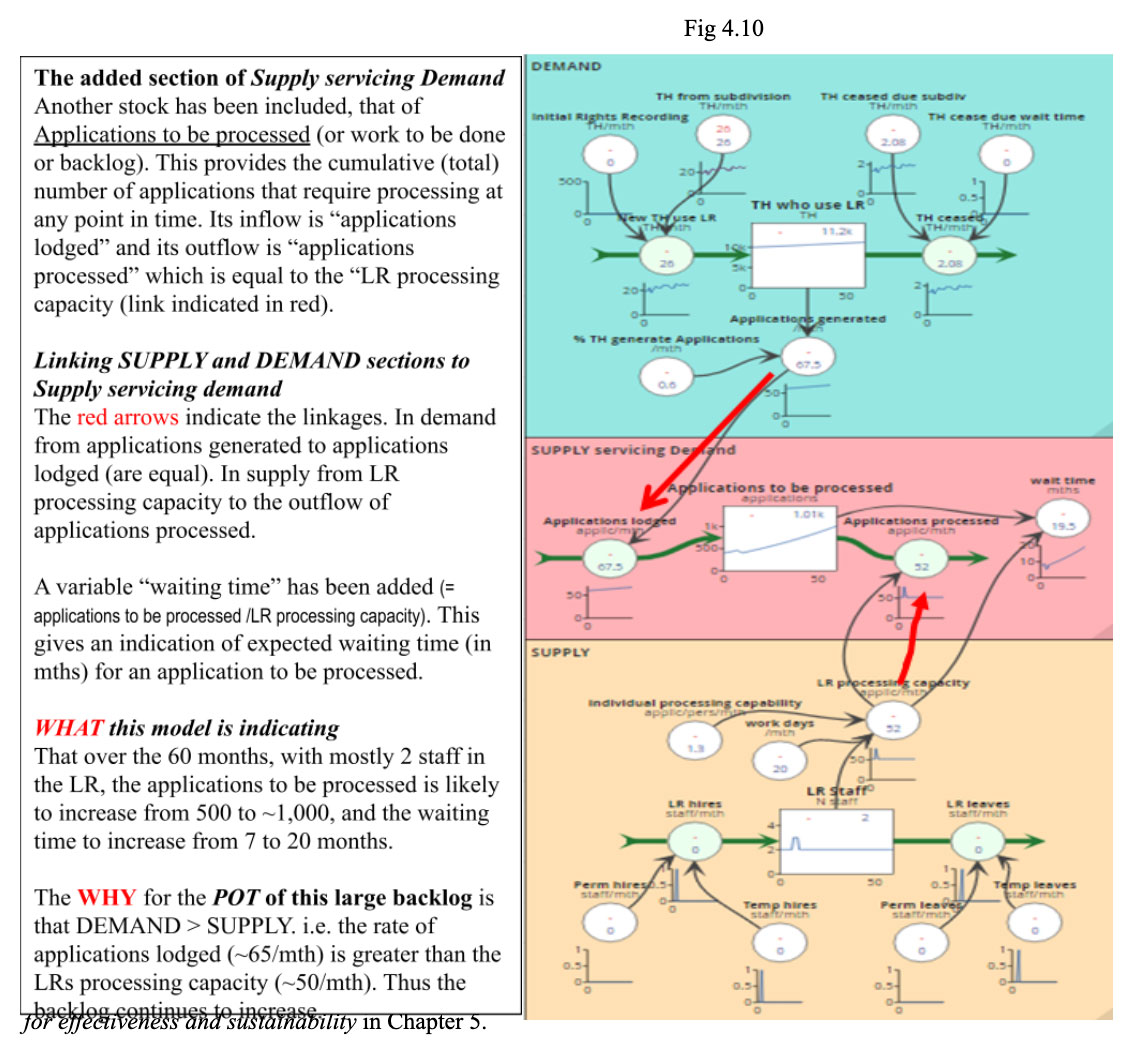
Performance Improvement Proposals (PIPs) for removing the backlog are discussed in Sec 4.9.1 and tested for effectivenessand sustainability in Chapter 5.
Some characteristics of the SD model in Fig 4.10
The SD model illustrated in Fig 4.12 has features of numeracy and transparency.
- Numeracy – all values and results are numeric, rather than descriptive
- Transparency – there are no hidden implicit assumptions. The logic (structure), initial values and formulae used are readily apparent, can be easily changed and instantly recomputed. POT (performance over time) graphs are shown.
These characteristics, and the value they bring, are further commented on in Chapter 8.
4.7 Principle #4 - Flow rates are driven by existing stocks, causing feedback, and affected by delays, external factors,and internal organisational decisions)
4.7.1 Feedback and delays
Feedback loops are a distinguishing feature of system dynamics and are used to incorporate indirect cause and effect. Feedback loops were introduced and illustrated in Chap 3 Sec 3.4. Long waiting times for applications to be processed gives rise to indirect cause and effect, or “effects on”, which, via the core structure of the model (the plumbing of the model), generate feedback.
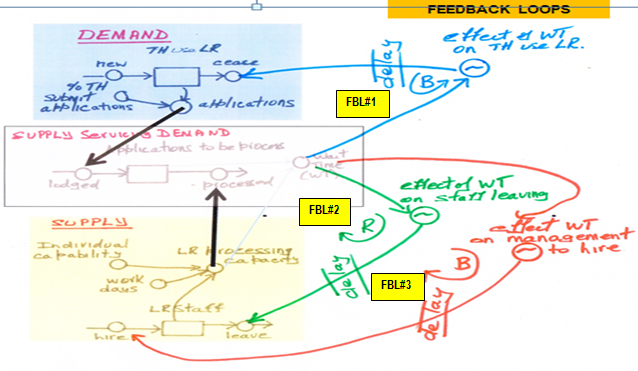
Waiting time causes three different “effects on”: -
- Effect on Titleholders who cease using the LR; feedback loop #1 (FBL#1) (depicted by the red dashed line in Fig 4.11)
- Effect on LR staff leaving (FBL#2) (depicted by the green dashed line in Fig 4.12)
- Effect on LR staff hirings (FBL#3) (depicted by the blue dashed line in Fig 4.12)
Fig 4.11 shows the first feedback loop incorporated into the SD model, and these loops are described in the following paras.
Fig 4.11
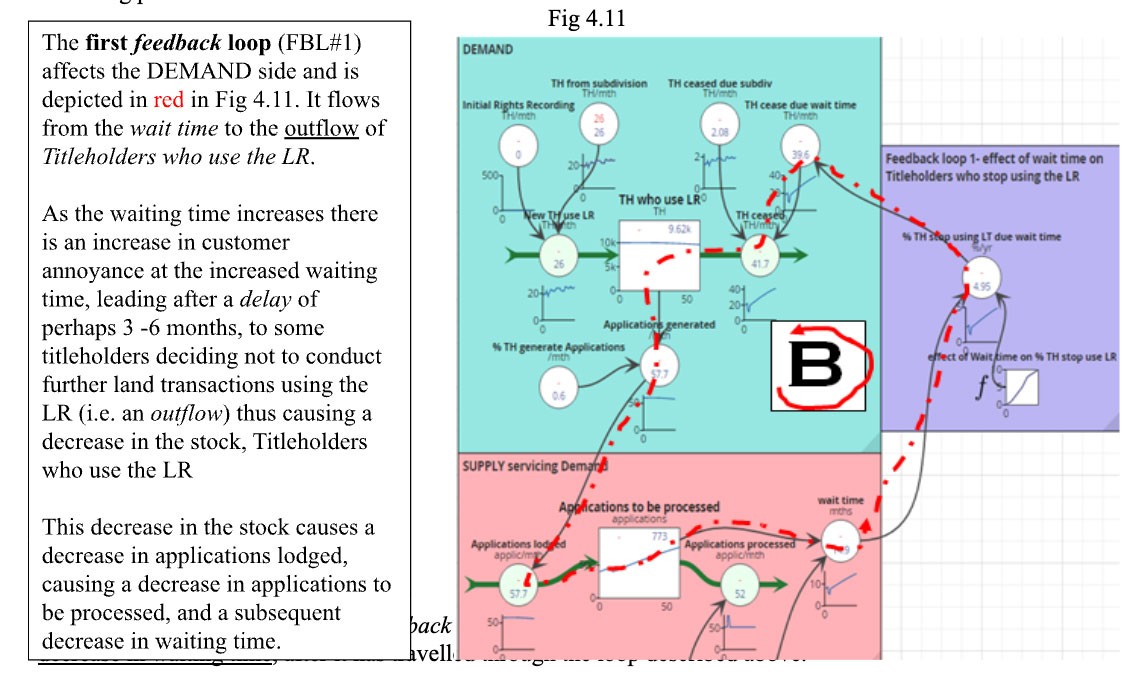
FBL#1 is termed a balancing (B) feedback loop as an increase in waiting time at the start, results in a decrease in waiting time, after it has travelled through the loop described above.
The numerical effect of this balancing loop can be seen in Table 4.1 which compares Fig 4.10 (no feedback loop) with Fig 4.11 (has the first feedback loop included).
Fig 4.12 includes feedback loops 2 and 3.
Fig 4.12
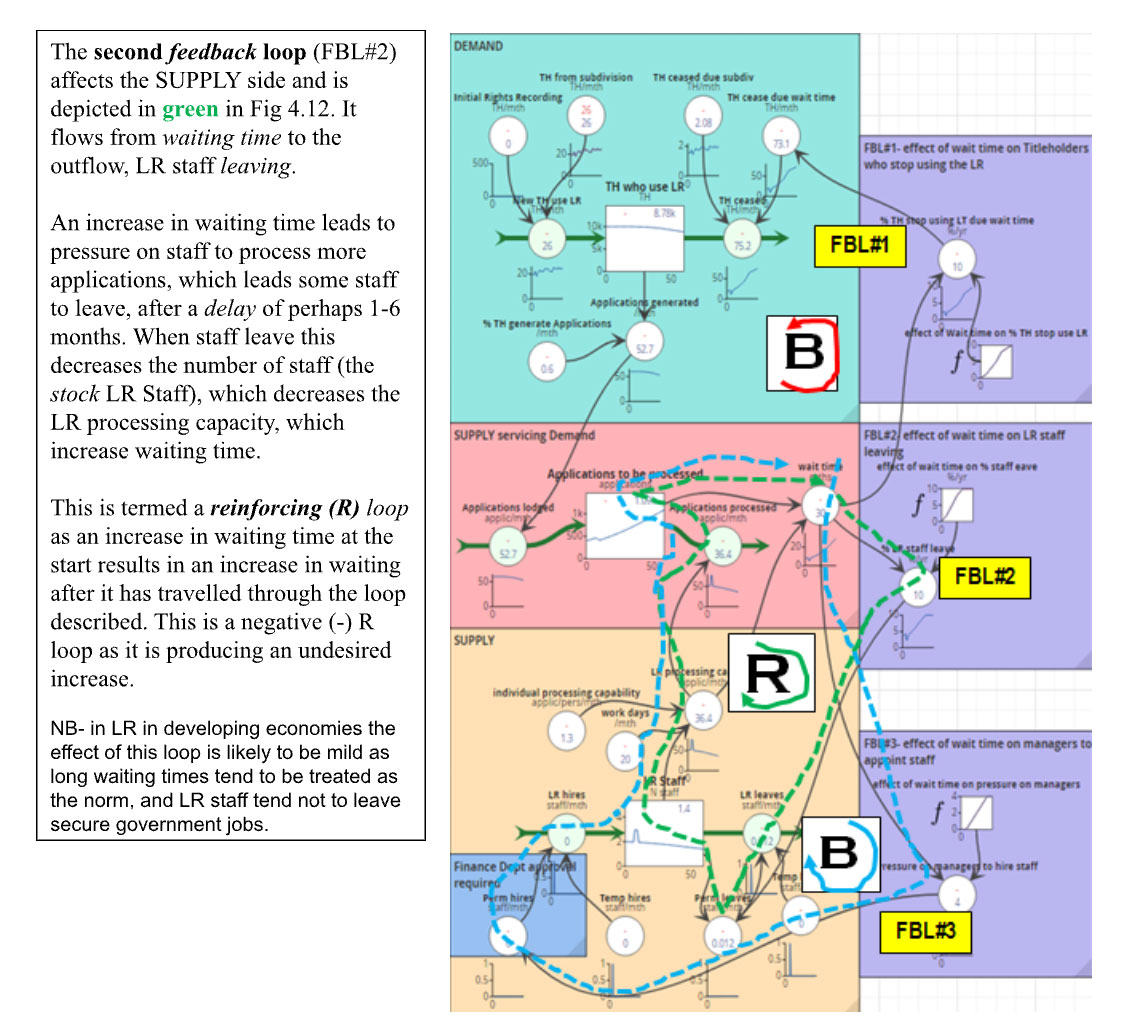
The third feedback loop (FBL#3) also affects the SUPPLY side and is depicted in blue in Fig 4.12. Itflows from waiting time to the pressure on management to hire additional LR staff.
As waiting time increases, LR customers put pressure on LR management and elected officials to hire additional LR staff. Additional staff increase LR processing capacity which causes a decrease in waiting time. This is a balancing (B) loop.
Note: for FBL#3 to be active a management decision must be made to actually hire more LR staff. (More on decisions is in Sec 4.9). There can be a long delay (6-24 mths) in developing economies from the actual LR management decision to prepare a case requesting more staff, until new staff actually arrive. The time delay can be for a Finance Department to approve the post and for the required salary to be included in an approved Agency annual budget. A person then has to be recruited and actually arrive in post. There can be a further delay while new staff gain the necessary skills and productivity.
In Fig 4.12 a blue box is shown around the variable Permanent hires indicating that Finance Department approval has to be obtained before hiring new staff. In this example Finance has withheld approval so no staff have been appointed, and FBL#3 has no effect.
Table 4.1
The mechanics11 of the effect of” xxx on yyy
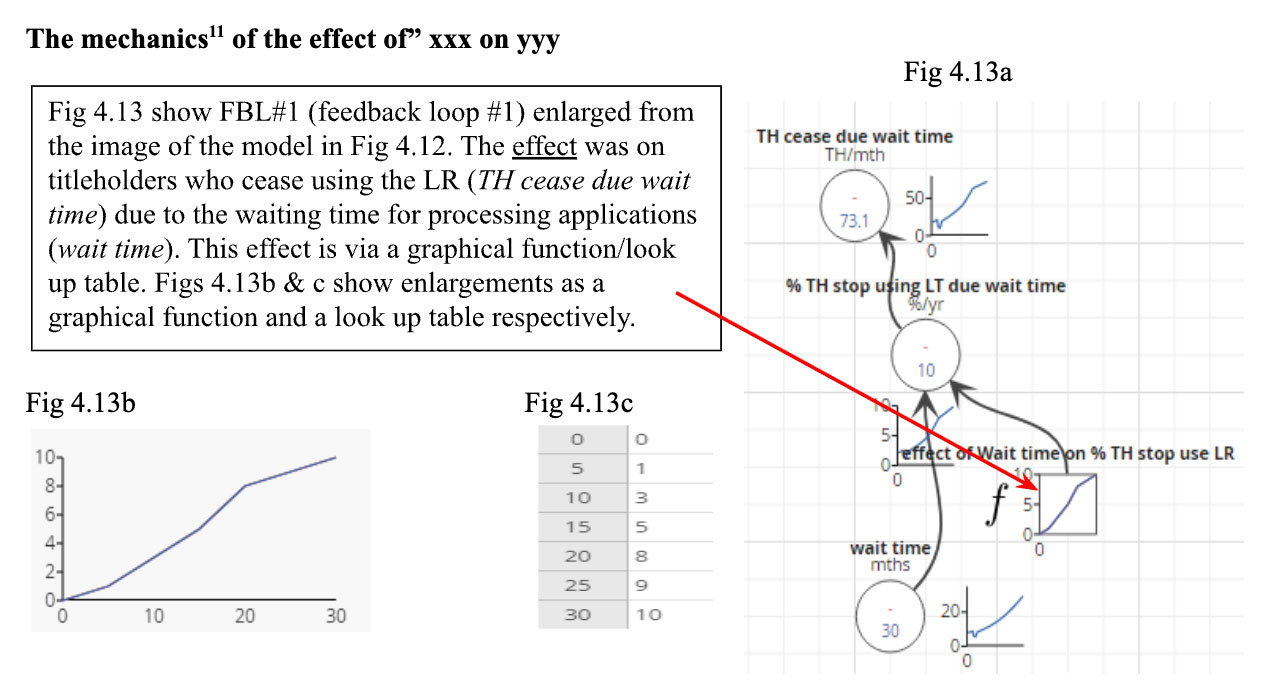
In Fig 4.13b the X axis is the waiting time in months, and the Y axis is the % per year of titleholders who will stop using the LR. In each month of the simulation the waiting time is calculated, the % per year is determined, and the number of titleholders who stop using the LR is calculated.
The mechanics of FBL #2 & #3 are similar. The shape and values in the graphical function will depend on the particular circumstances, though, investigation and experience is required in deciding on the curve.
Effects of Feedback Loops on the POT of a system
The POT of a system is largely determined by the core structure of the system and the causal relationships (nonlinear, feedback loops with delays) illustrated above in Figs 4.11 to 4.14).
The interaction of the various feedback loops over time produces the dynamic (changes over time) characteristic to the system. Non-linearity (represented as graphical functions) determines the strength of feedback loops over a stock at any point in time. A visual inspection of Fig 4.12 show that the different duration of the delays will cause different rates of inflow and outflows to the various stocks at particular times, causing the feedback loops to have different effects. Delays often cause things to get worse before they get better.
In LRs in developing economies the feedback loops are often coupled with long delays. Long waiting times can be considered usual, and a lack of budget from a treasury department is often given as a reason for an inability to improve the situation.
In LRs in developed economies the feedback loops are often coupled with short delays, as LR customers (individuals and corporates) would demand action from senior public servants and government ministers if LR processing was taking too long.
Feedback loops and nonlinearity allow feedback loop dominance to change. A reinforcing loop in a model can dominate the stock giving exponential growth. As time goes on the balancing loop can start to dominate so the stock begins to decelerate in the shape of a straight line and then to exponential decay.
4.7.2 Decisions
Decisions (taken or not taken) can have an impact on the dynamics of a system. An example of the incorporation in a model of a “Decision Required” was shown in Sec 4.7.1 and Fig 4.12 when discussing feedback loop #3 (FBL#3). This feedback loop involved pressure on LR management by customers to reduce the long waiting times by appointing more LR staff to process applications thus reducing the waiting time. However, LR management cannot appoint any extra staff unless the Finance Department have approved (made a decision) funds for the position. In Fig 4.12 funding approval was not given, hence feedback loop 3 is not active.
Decisions can be external or internal.
External Decisions
External decisions can be considered as out of management control, but still need to be taken into account by management. Some types of external decisions could be those relating to, the introduction of new laws, a Government decision to transfer a LR from a department of justice to a department of lands or to form a PPP (Public Private Partnership).
Internal Organisational Decisions by Management of a Lands Agency or LR
The types of Decisions that might be considered will depend on the aspect of LA being examined. Some areas could be: -
- Remove a processing backlog (the example in this chapter)
- Improve the quality and reputation of the LR (covered in Chapter 9).
- Increase the number of Titleholders who use the LR by a campaign to convince those titleholders conducting land transactions outside the LR, of the benefits to sellers, buyers, lenders of the advantages of using the LR (covered in Chapter 9).
- Increase the LR annual O&M (operations and maintenance) budget (covered in Chapter 9).
- Increase the average skill level of staff (covered in Chapter 10.)
- Conduct IRPR (Initial Recording of Property Rights) to increase tenure security to landholders. IRPR would significantly increase the number of Titleholders and the number of applications submitted to the LR) (covered in a later chapter).
- Reduce the prevalence of the payment of informal fees (covered in a later chapter).
- Making LR fees more affordable to the average landholder.
In Sec 4.3 the story line for this example was introduced. The PIO (performance improvement objective) was toremove the processing backlog in the LR (with aid) and to keep it low (post aid). The possible “internal management decisions” re achieving this PIO would relate to what actions or PIPs (performance improvement proposals) would most likely reduce the backlog and keep it low. Possible PIPs are examined in Sec 4.10.
Summary – Secs 4.4 to 4.7 inclusive which cover the four SD Principles
Sections 4.4 to 4.7 explained the four principles that the SD approach is based on, and illustrated their application by progressively building a simple SD model for the system of applications being generated and processed in a LR. Fig 4.12 showed an image of the SD model.
As stated in Chapter 1, the aim of this booklet is to show how the SD approach can be used and the results obtained via illustrative examples, and not to show how SD models are built. For those interested in learning to build models, the online core and extension courses12 of Warren are recommended.
4.8 A SCS (Schematic of Core Structure) of the System whose Performance is to be Improved
This subsection returns to the story line of the first backlog example. Sec 4.3 refers. It draws on what was illustrated in Secs 4.4 to 4.8 to compile a SCS (Schematic of Core Structure). Step 1 of the SD approach, the determination of the PIO (performance improvement objective), was done in Sec 4.3. Step 2, the drawing of POT graphs was done in Sec 4.4. This subsection deals with step 3, the compilation of a SCS of the system whose performance is to be improved.
[The building of an SD model is step 4 in the SD approach. This was done out of sequence in Sec 4.4 to 4.8 above as the purpose was to explain and illustrate the four SD principles with an example. In this subsection we will use the SD principles, terminology and symbols to develop a SCS.]
The purpose of a SCS is to quickly produce, at an early stage, a schematic of the core structure of the system whose performance is sought to be improved. In this first example thesystem is that which generates and lodges applications in a LR (land registry) where the applications are processed by the LR.
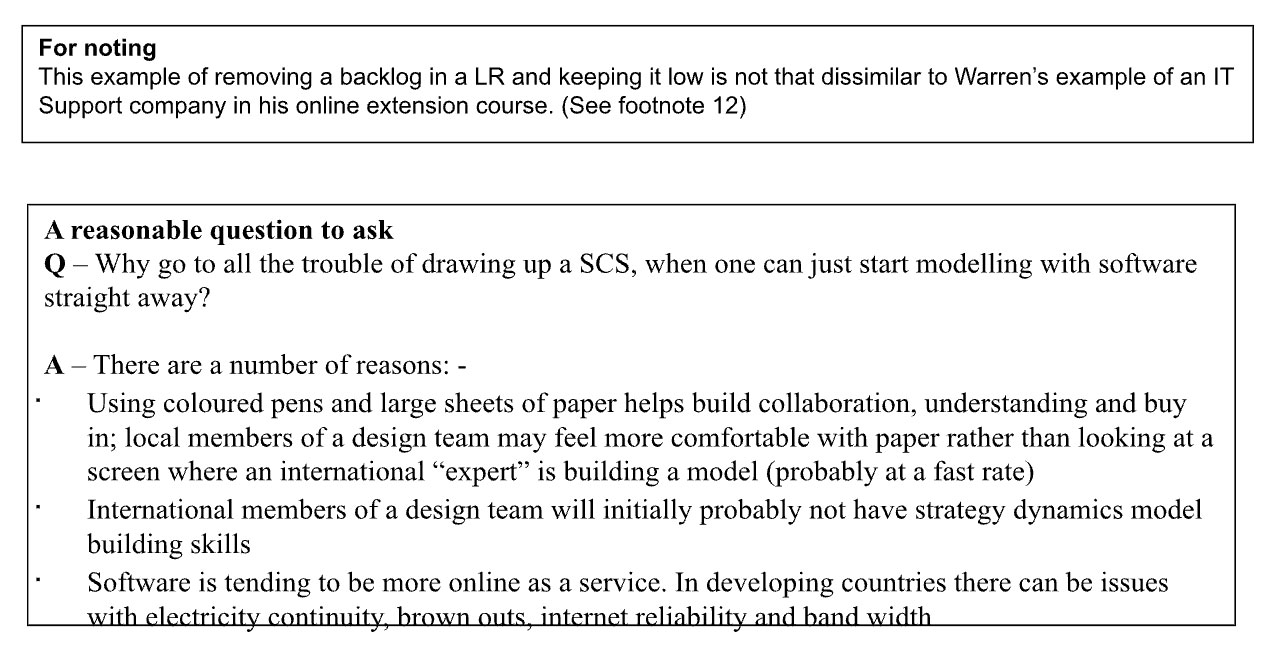
There will likely be several iterations of the SCS during early brainstorming by a project feasibility or design team, composed of both local and non-local specialists. The aim is to quickly produce a schematic that portrays the system that can be accepted by all, and for the SCS to be used to reach a joint understanding of the system and its dynamics, and where there may be potential interventions to improve the performance of the system. This will assist “buy in”. Paper and coloured pens can be used to quickly draw a SCS. A completed SCS will assist model building.
4.8.1 A 1st Pass of the SCS where Performance is to be improved
A useful way to proceed is by thinking of system segments such as: - DEMAND; SUPPLY; SUPPLY servicing DEMAND; FEEDBACK. This is essentially following the sequence used in Secs 4.4 to 4.8.
For each segment it is useful to identify: - the main stocks with their inflows and outflows; main variables; how these may be linked, where the feedback loops are.
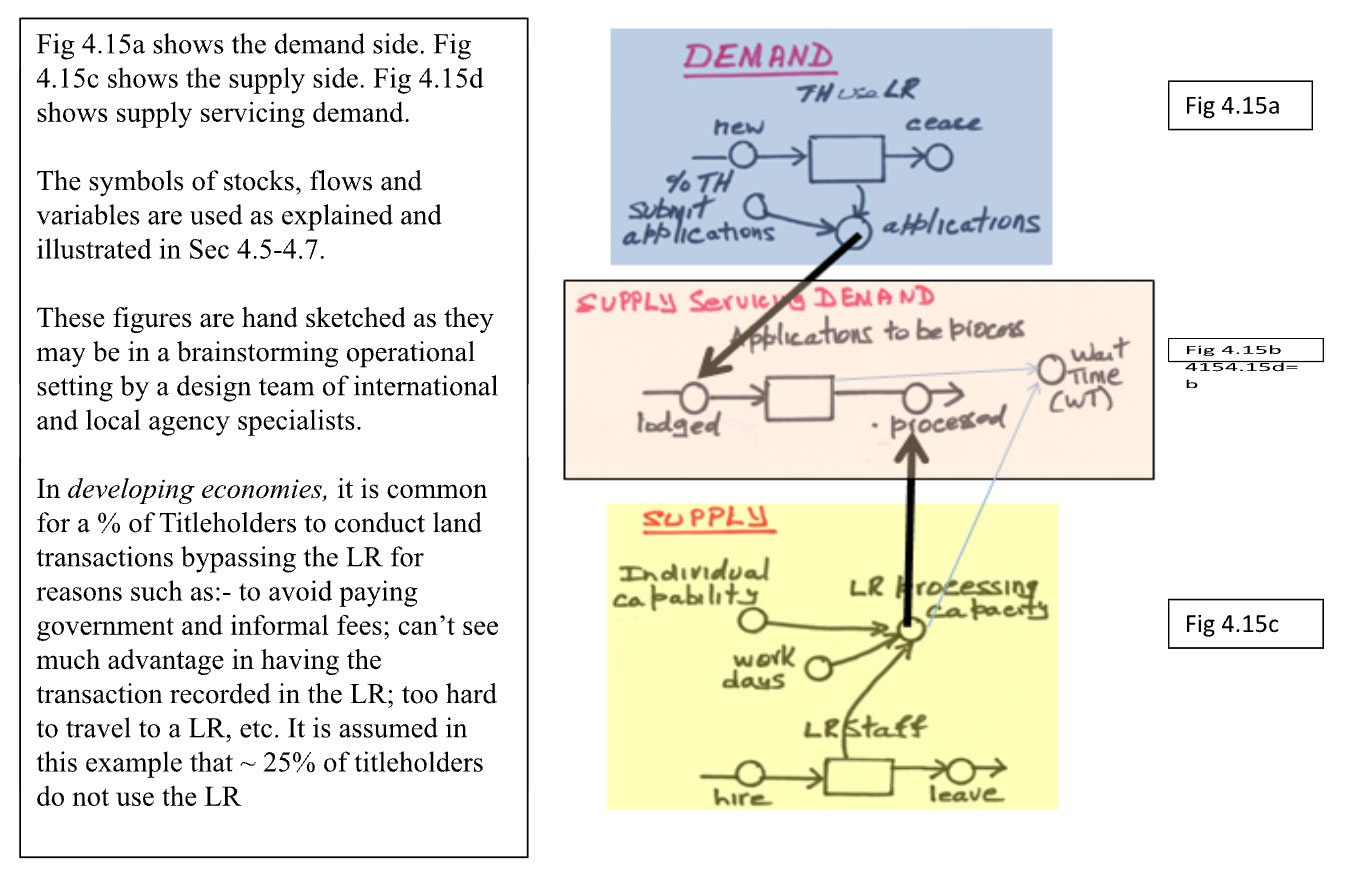
Fig 4.15d includes the feedback loops as explained in Sec 4.7.1.
Fig 4.15d
Observations that can be drawn from the 1st Pass of the SCS
As well as examining the SCS, it is also necessary to include the observations drawn from the POT graphs of backlog (Sec 4.4.2), and observations drawn from the Why, Why, Why diagram (Sec 4.4.1). The following observations can be drawn: -
- That demand (applications for processing) is greater than supply (capacity of the LR to process)
- Processing capacity is low because: - individual productivity is low (low skills; process & workflows unclear and cumbersome); budgets are insufficient for technology)
- The balancing feedback loop, effect of wait time on titleholders leaving, can be strong (long waiting times causes titleholders to no longer use the LR). However, the two other feedback loops are very weak. The reinforcing loop, effect of wait time on staff leaving, is weak as most staff do not wish to leave a secure government job, even if the salary is low. The balancing loop, effect of wait time on management hiring more staff is very weak as Treasury Department will not provide the finance for extra staff.
These observations provide a base to compile a list of potential PIPs (performance improvement proposals). Further observations will be added in Sec 4.9.1.
4.9 Possible “DECISIONS” by LR Management to achieve the PIO (performance improvement objective)
LR Management and its IDA partner will be required to make some management decisions re the actions they consider could achieve the PIO, remove the backlog and keep it low. Some comments were made previously in Sec 4.7.2 re internal decisions.
There are four steps: -
- Compile a list of Performance Improvement Proposals (PIPs)13, i.e. possible actions that might remove the backlog and keep it low
- Incorporate these PIPs into the SCS
- Test for effectiveness and sustainability the various PIPs using the SD model (covered in Chapter 5)
- Identify the strategy for improvement (also covered in Chapter 5)
Following the above a management decision can then be made on whether or not to proceed to implementation. (Project Evaluation is covered in Chapter 6).
4.9.1 Performance Improvement Proposals (PIPs) – a 1st Pass
A number of possible Performance Improvement Proposals (PIPs) were identified in discussions between the in country land agency/LR and the IDA provider on possible ways to remove the large backlog in the LR (with aid) and keep it low (post aid). These discussions were informed by the 1st pass of the SCS.
The 1st pass of PIPs from brainstorming is shown in Annex D. Some were dropped and these together with reasons are shown in Annex D. Table 4.2 lists the PIPs that were agreed should be tested for effectiveness and sustainability. It was decided to include the case of no IDA support provided (PIP#1) which is equivalent to the LR “continue as is” /base case. i.e. the backlog continues to increase. This is a feared future POT of Fig 4.3b. PIP#2, same aid as previously, was included as this is also the feared future POT of Fig 4.3c.
Table 4.2
| No. | Performance Improvement Proposals (PIPs) |
|---|---|
| 1 | IDA funding/support not provided. |
| 2 | Continue to only employ temporary staff, with IDA funding, to clear the backlog when it gets too high. |
| 3 | Improve the efficiency of LR procedures, within the authority of the CEO, to reduce the time taken to process an application. |
| 4 | Modify some laws and regulations that are considered out of date and/or too restrictive, with legislative approval necessary, leading to reduced time to process an application. |
| 5 | Increase LR staff skill levels, leading to reduced time to process an application. |
| 6 | Use some combination of PIPs 2–5 above; for example, use temporary local staff once off to significantly reduce the backlog, while at the same time using technical assistance to improve the efficiency of procedures and increase LR staff skills and capability. |
Fig 4.15e shows the PIPs included in the 1st pass of the SCS. The red arrows from each PIP show what particular part of the system they affect. The light switch besides each PIP indicates that in the SD model PIPs can be turned on/off in any combination to examine their effects.
Fig4.15e
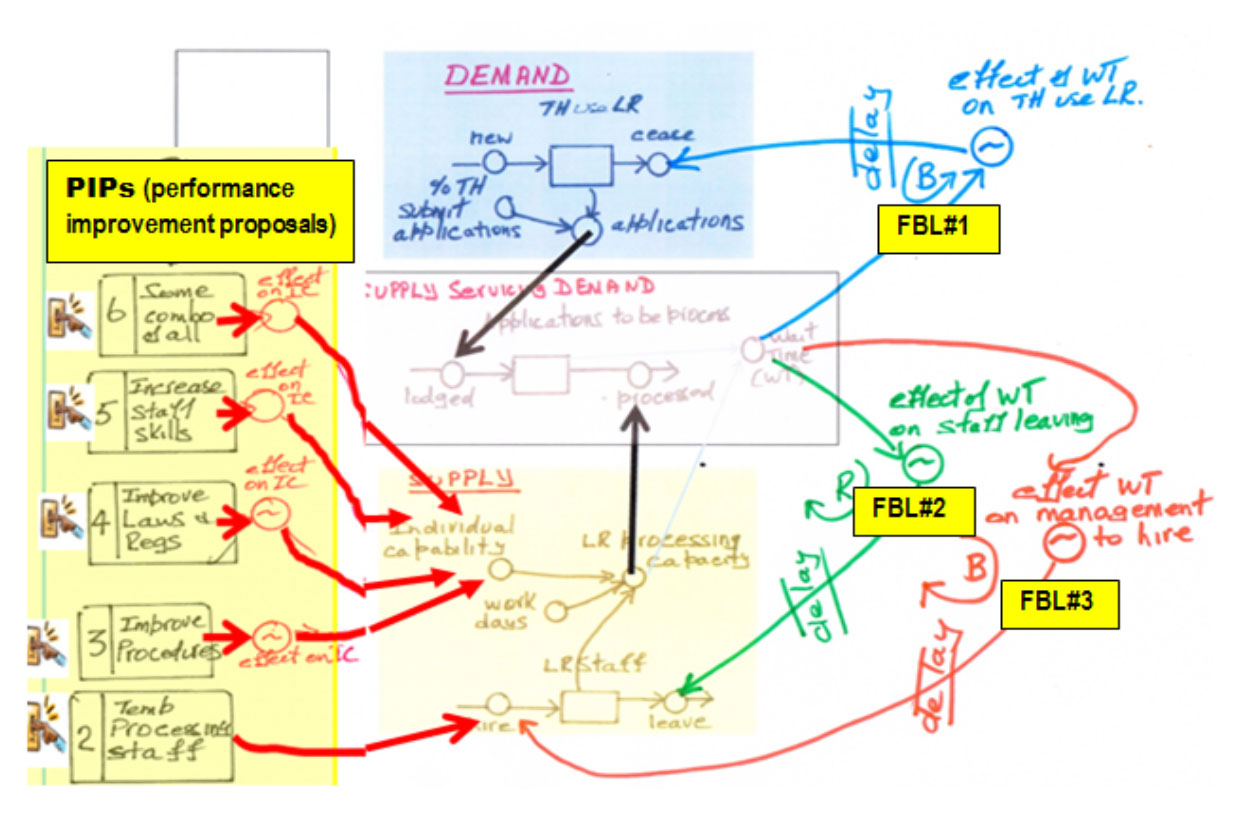
PIPs have a Supply side focus rather than a Demand side focus
The development task being illustrated is that of removing the backlog and keeping it low. The couching of the task in terms of backlog gives it a supply side or internal LR focus. The backlog is clearly visible to LR staff and management as files on desks (or in computer system) waiting to be processed. The size of the backlog is not visible to LR customers and Titleholders who have lodged applications. The concern, from a customer or demand side, is the length of the time they have to wait for their application to be processed.
The PIPs are focused on improving the performance of the supply side, as can be seen from the red arrows in Fig 4.15e emanating from the PIPs to a particular segment on the supply side.
It would be possible to include skills training for major and regular LR customers (banks, developers, notaries etc.). This training could cover LR procedures and forms, common problems with applications, and the like. If applications of a higher quality were lodged, then LR productivity should rise and customer waiting times fall and customer satisfaction rise. This is not included in this example for simplicity.
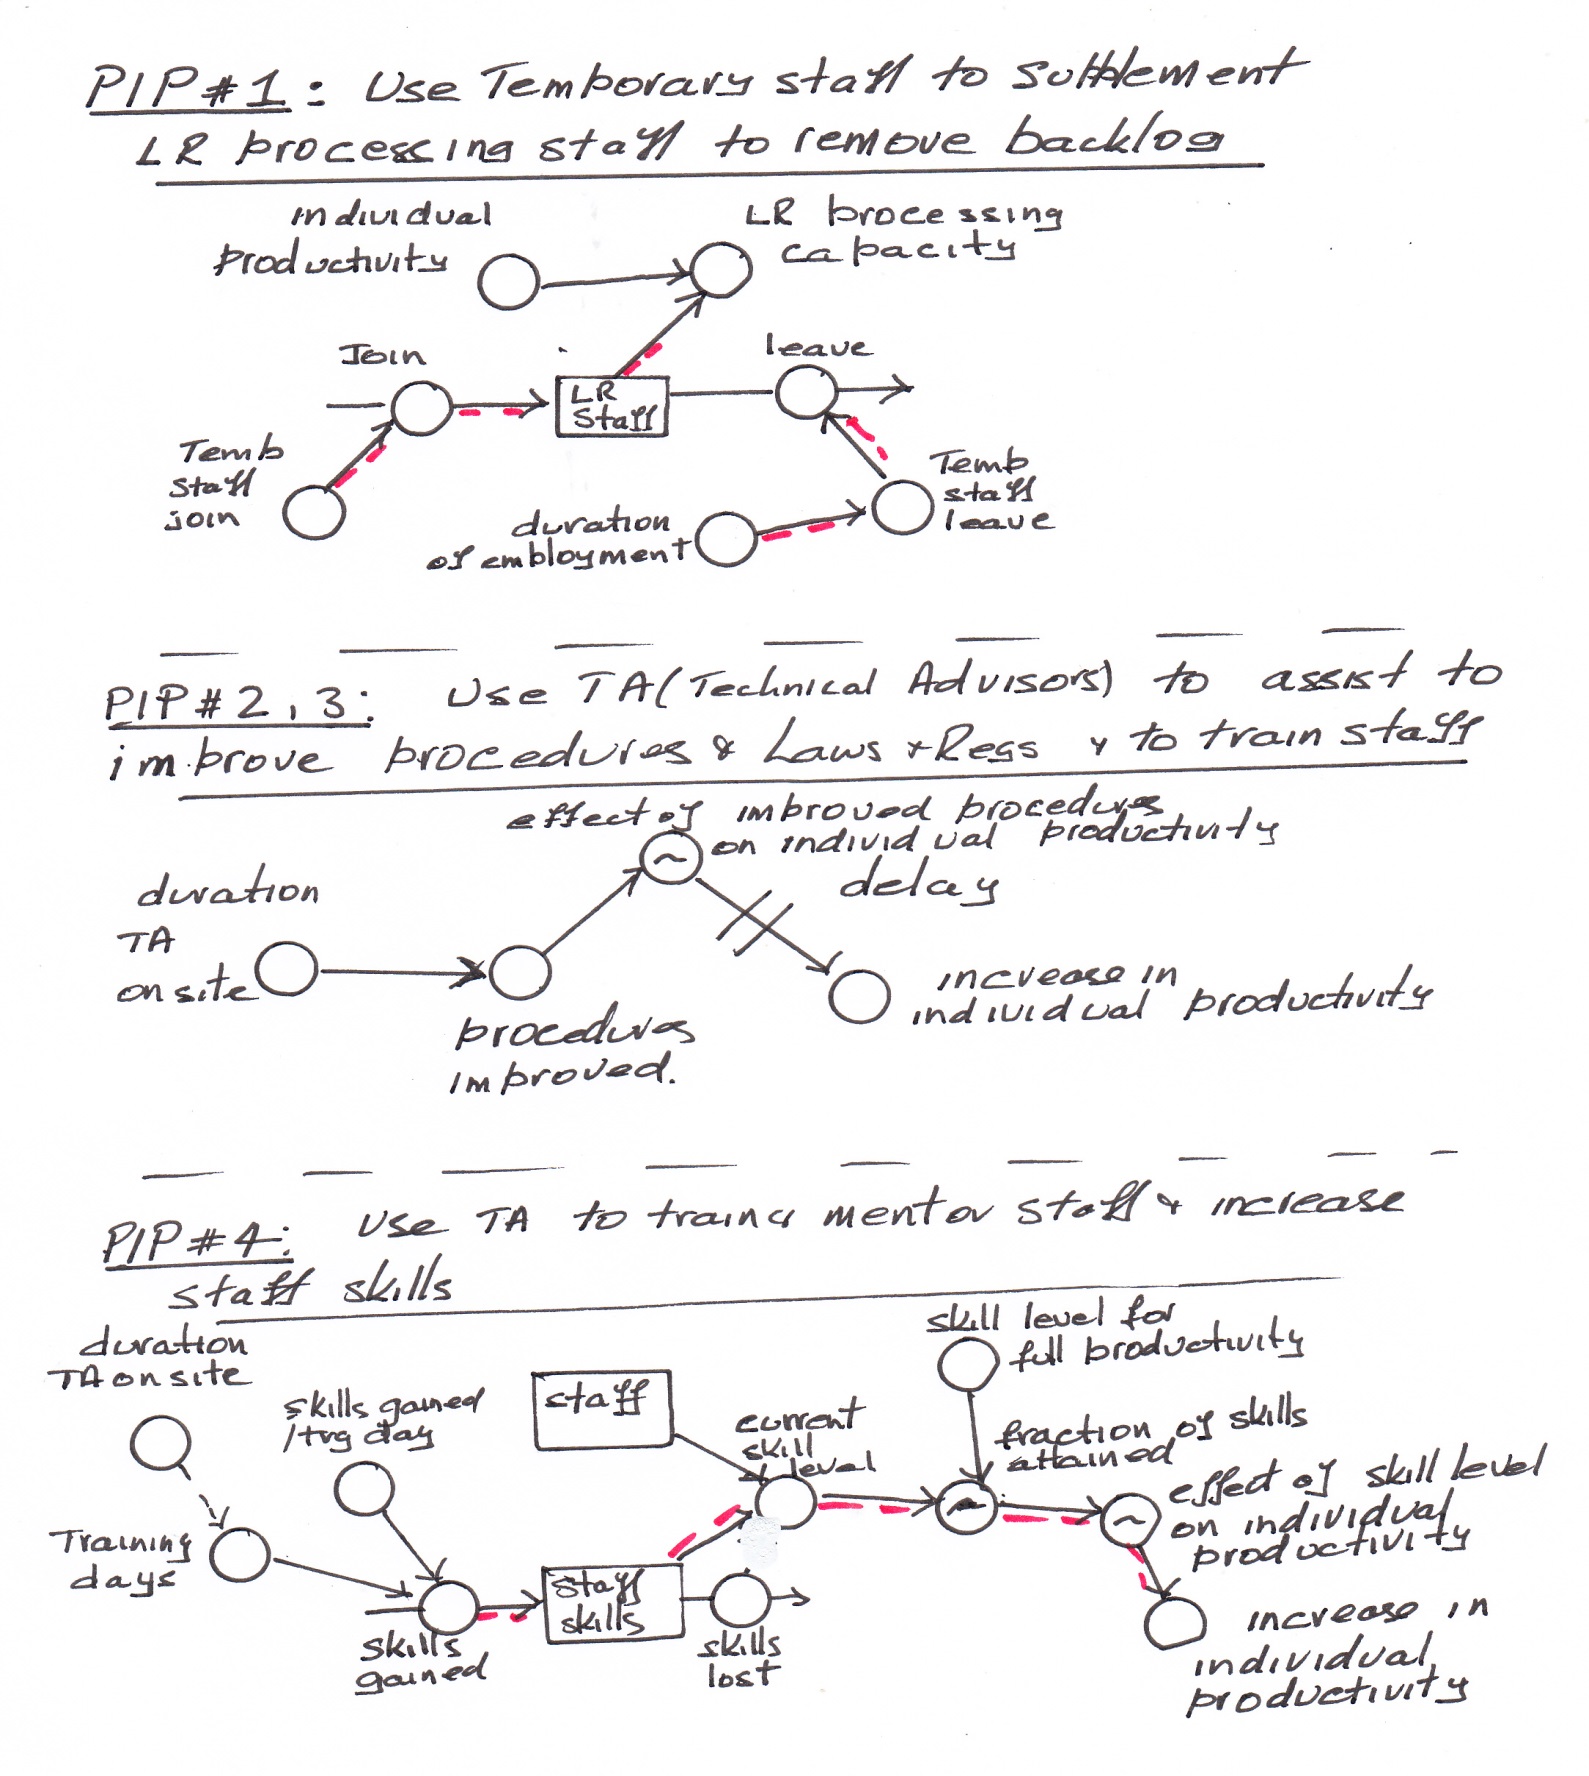
A SCS (schematic of the core structure) of each PIP
While Fig4.15e provides a SCS of Demand and Supply it does not indicate the SCS of each PIP. These are shown in Annex F.
As noted previously, the purpose of this booklet in not to show how to build a SD model, but rather to explain what the SD approach is, how it can be used, and the results obtained from using. For those interesting in learning how to build SD models Warren’s online courses14 are recommended.
A 1st Pass at PIP inputs
Table 4.3 shows a 1st pass at possible inputs, durations and indicative impact for each PIP. Annex E provides more detail. This was the result of brainstorming by the design team of international and local agency specialists.
Table 4.3
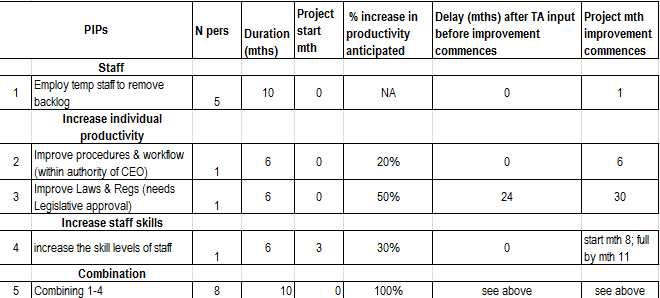
NB: Even though it has taken most of this Chapter to describe POTs, PIPs and to develop the SCS, in practice a 1st pass at a SCS such as Fig 4.15 and Table 4.4 can be hand drawn quickly in a working meeting between an IDA team and in country LR personnel.
Additional observation from this 1st pass of the SCS (Fig 4.15e) and Table 4.3
Following Fig 4.15d, observations from the first pass of the SCS were drawn. To these can be added (drawn from Fig 4.15ee and Table 4.3):-
- All PIPs aimed at improving the supply side
- PIPs #2,3,4 aimed at improving individual productivity by ~100%, and hence sustainability
- PIP#1 will assist to remove the backlog, but will not contribute to sustainability post aid
- If the Laws & Regs changes (PIP#3) are not passed by the relevant Legislative body, then only ~50% of the target for improved performance will be achieved, and sustainability post aid is unlikely to be achieved.
The above provides much useful information and understanding to the joint international and local design team, but it has some limitations. It is however a possible point at which a start could be made on building an SD model.
Limitations of the 1st Pass of the SCS
The major limitation is that this first pass is essentially qualitative. The only hard number is the past POT of the backlog (Fig 4.1). There are still virtually no numbers (even if only indicative) on the stocks, flows and variables of the system depicted in Fig 4.15d. These are essential for quantitative SD model building and the numeric generation of future POTs which in turn allows the testing of PIPs for effectiveness and sustainability (detail in Chapter 5).
A 2nd pass at the SCS will provide the additional necessary information.
4.10 A 2nd Pass at the SCS
It is very useful to do a 2nd pass at the SCS in country. It provides further group learning experience and understanding for the joint design team, as it also provides the data necessary for modelling. The data being sought, even if indicative and best estimates, will be obtained from the knowledge of the local specialists.
The information sought will be: -
- Identification of the KPIs & PIs (key & performance indicators) of the system depicted in the SCS (Fig 4.15e)
- Data on the main stocks and flows and variables
- The form of graphical function for “effects of …. on …. “
4.10.1 KPIs and PIs (key and performance indicators)
This is step 3b in SD approach. Fig 4.15f shows KPI and PI located on the SCS. Comments follow.
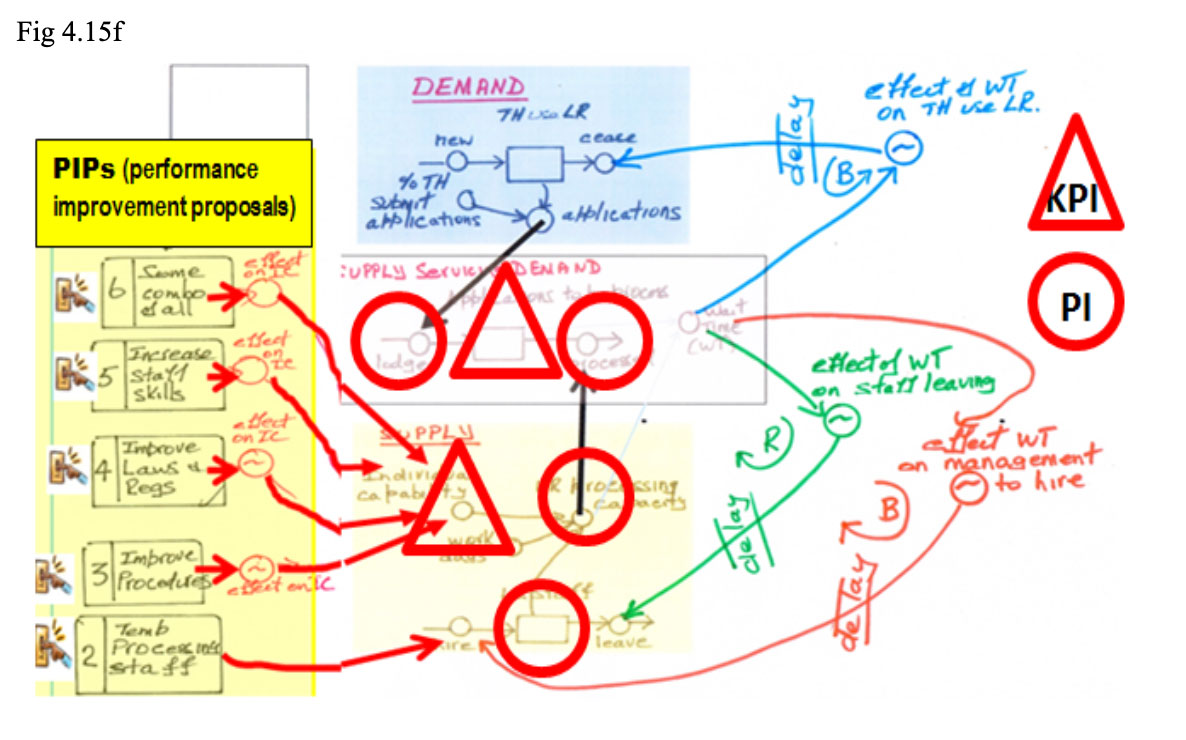
KPIs
KPIs are few in number and are entities whose POT values and trajectories need to be watched closely to gauge progress.
One KPI is obviously the PIO (performance improvement objective), backlog. Fig 4.3a showed past and desired future POT values and trajectories, and Figs 4.3b, c showed two feared future POTs.
The other KPI is individual capability (productivity), Fig 4.15e refers. This is a KPI as four of the PIPs are aimed at improving its value. If individual capability is not increased significantly, then LR processing capacity will not increase significantly, and backlog and waiting time will not sustainably decrease. [Exercise- in Fig 4.15e trace out the path that individual capability effects].
PIs
PIs can be identified from the SCS, Fig 4.15e, as important entities which affect the KPIs or are important in their own right.
A KPI (& PIO) is backlog (a stock) so its inflow, applications lodged, and its outflow, applications processed, will be PIs. A PI is staff (a stock). If staff are absent for any significant time this will lower LR processing capacity and applications processed [LR processing capacity = applications processed = staff (a PI) x workdays x individual capability (a KPI)].
Other
The stock, titleholders who use the LR, is not a PI per se in this example but is important. In the story line of this example, it was noted that ~20% of titleholders are guestimated to not put their land dealings through the LR. [The second illustrative example in Chapter 9 includes a win back campaign to attract back titleholders who do not currently use the LR].
Units
It is important to be clear on the units of the KPIs and PIs. They are shown in Table 4.4.
Table 4.4
| KPI / PI / Other | Units |
|---|---|
| Key Performance Indicators (KPIs) | |
| The backlog / applications to be processed | Number of applications |
| Individual capability / productivity | Applications processed per person per day |
| Performance Indicators (PIs) | |
| Applications lodged | Applications lodged in LR per month |
| Applications processed | Applications processed by LR per month |
| LR staff | Number of staff in LR |
| LR processing capacity | Applications per month that LR should be capable of processing |
| Other | |
| Titleholders who use the LR | Number of titleholders who use the LR |
4.10.2 POTs of the KPIs and PIs
Fig 4.16 shows best efforts at compiling POT graphs for KPIs and PIs for past and desired future performances for this first illustrative example. As noted in Sec 4.3.3, for LRs in developing economies, data on past performance can be hard to determine and is often incomplete. [Fig 4.16 and Figs 4.17a, b are hand sketched as they might be from a working meeting of an in country design team].
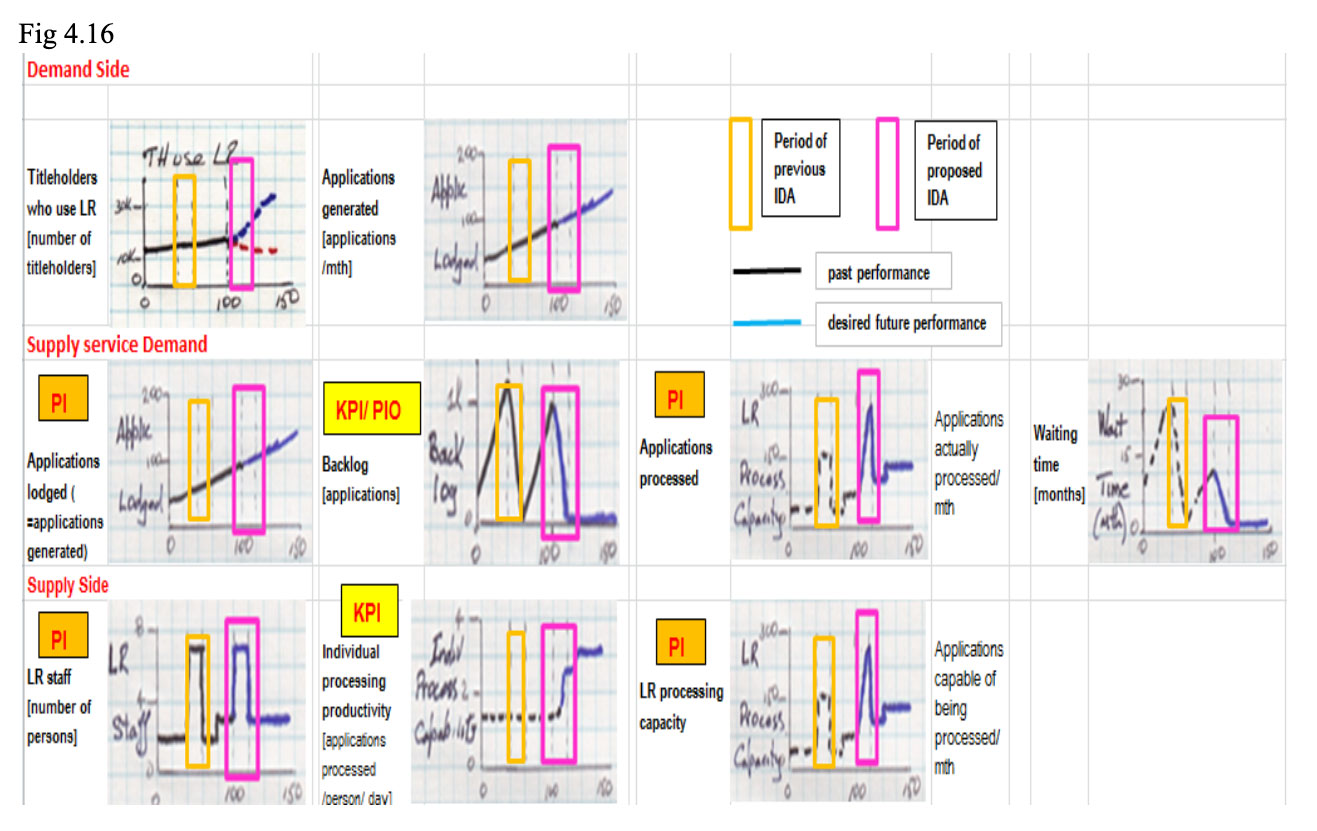
NB
- Applications generated = applications lodged
- Applications processed = LR processing capacity except where backlog < LR processing capacity
- For completeness POTs have been compiled for other entities in the SCS
- An examination shows for the KPIs, and the PIs of applications processed and LR processing capacity, the difference expected post aid, between this proposed aid and the previous period of aid
- The horizontal axis is months 0 to 150.Time NOW is mth 100
In Chapter 5 the SD model will generate future POTs for the KPIs and PIs for each PIP enabling the effectiveness and sustainability of each PIP to be examined.
KPIs and PIs are further used in Chapter 7 when showing how the SD model can be used for M&E (monitoring and evaluation) during project implementation with aid, and then post aid.
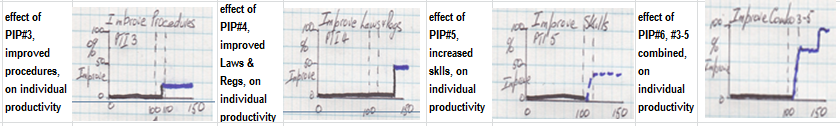
4.10.3 Indicative shapes of “effects of…. on ……”
Fig14.f of the SCS shows the three feedback loops and the symbols for the graphical functions
that the effect that waiting time for processing has. Fig 4.17a shows a 1st pass at the three graphical functions.
Feedback loops were explained in Section 4.7.1, and the mechanics of “effect of …on…..”, and the shape of graphical functions were explained in the text associated with Fig 4.13a,b,c.
Fig 4.17a
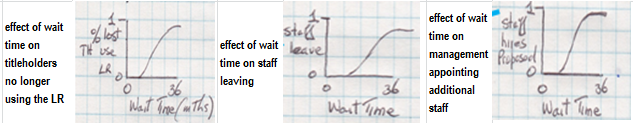
Fig 4.15f showed that each of PIPs#3-6 have an “effect on individual capacity (productivity). Annex F showed a SCS for each of these PIPs. Fig 4.17b shows a 1st pass at the graphical functions that indicate the anticipated effect of each PIP on individual capacity (productivity).
Fig 4.17b
4.10.4 Observations that can be drawn from the 2nd pass at the SCS (Fig 4.15f) and Fig 4.16 and Fig 4.17a, b
Observations from the 1st pass at the SCS were listed were listed following Table 4.4. It can be helpful on site to greatly enlarge the SCS and superimpose the various graphs of Figs4.16 and 2.17a, b as an aid for discussion and understanding
The following additional observations can be drawn from the 2nd pass at the SCS.
- KPIs and PIs of the system have been identified, and indicative POT graphs compiled of past performance and possible future performance with proposed aid. What drives what can be seen from Fig 4.15f
- Time 0 mth is when data can be estimated from; Time 36 mths is when the first IDA was provided, in the form of five temporary processing staff for 14 months. This IDA removed the backlog, but did not keep it low. Current time is Time 100 mths, when IDA has been again requested to remove the backlog
- There is little doubt that the backlog can be eliminated by using additional temporary staff (PIP#2) as previous aid has achieved this.
- On the supply side, individual processing capability of ~1.4 applications/person/day seems low for comparable situations and approximately 1 effective working day/ person/ week seems to be lost due to cultural and clan business. This results in a low total LR processing capacity which is less than demand, thus causing the backlog.
- Individual processing capability/productivity is THE KPI as: -
- the aim (with aid) is to basically double productivity and for that to be sustained post aid. [productivity to increase from 1.4 to 2.8 applications processed/person/day . via, improved procedures and workflow by ~20% (PPIP#3); via changes to laws & Regs by ~50% (PIP#4); via increasing skills by ~30% (PIP#5)].
- Individual productivity has a major impact on backlog, the PIO and a KPI. If productivity doubles, then LR processing capacity (supply) should approximately double, thus ensuring that supply should be greater than demand (applications lodged) for some time, thus keeping the backlog very low.
- If backlog can be kept low, then waiting time will be low, and titleholders should no longer stop using the LR because of long waiting times, i.e. feedback loop #1 will have little impact, (1st graphical function of Fig 4.17a refers)
- If the doubling of productivity can be achieved with aid, and sustained post aid, then the PIO will most likely be sustained post aid.
- Keeping the backlog low post aid will rely on LR staff and management maintaining the processing improvements post aidthatareaimed for during the aid period.
- A serious risk is that if the Laws & Regs changes (PIP#3) are not passed by the Legislative body (hoped for ~2 years after aid finishes), then only ~50% of the target for improved performance will be achieved, and long term sustainability post aid will unlikely be achieved. (The effect of this risk is examined as a What If in Chapter 5).
- Building the SCS up in stages while in country will help project design members (often from diverse backgrounds and skill areas), in a group learning experience, to understand the main structure and dynamics in play. This will foster “buy in” from those in country who will be participating in the IDA project and have to live with the results, post aid. Annex G shows the observations that were drawn as the SCS was built up.
- The 2nd pass at the SCS provides sufficient information for a 1st pass at a SD model and its use quantitatively to test the PIPs for effectiveness and sustainability (chapter 5 refers).
4.11 Key Points
- Strategic management is about building and sustaining performance into the future, and this is essentially what IDA seeks to achieve. The aim is to improve the performance over time (POT) of a system.
- There are four underpinning principles of SD and a number of steps in the SD approach, as illustrated.
- POT (performance over time) graphs are a powerful way to show PIs (Performance Indicators) past performance, the likely (feared) future POT if no changes are made, and the desired future POT and to pose the important questions of WHY, WHERE, and HOW.
- It is possible to quickly produce a SCS (schematic of core structure) of the system in which performance is sought to be improved, and to draw useful qualitative operational observations.
- Building the SCS up in stages while in country will help project design members (often from diverse backgrounds and skill areas), in a group learning experience to understand the main structure of the system and the dynamics in play. This will foster “buy in” from those in country who will be participating in the IDA project and who have to live with the results, post aid.
- The final form of the SCS and observations drawn, while quite useful, are essentially qualitative. However, they provide necessary material for building a quantitative SD model and for testing PIPs for effectiveness and sustainability.
References cited
The next chapter will outline the SD model that was built based on the SCS and test the PIPs listed in Table 4.4 for effectiveness and sustainability.
References
English C, A Locke, J Quan, J Feyertag, (2019). Securing land rights at scale: Lessons and guiding principles from DFID land tenure and land sector support programmes. https://www.researchgate.net/publication/333658289_Securing_land_rights_at_scale_Lessons_and_guiding_principles_from_DFID_land_tenure_regularisation_and_land_sector_support_programmes_NonCommercial_Licence_CC_BY-NC_40
Warren (2020), Living Business Models, Strategy Dynamics Ltd
Warren K (2009), Strategic Management Dynamics, John Wiley & Sons Ltd
Warren K (2010), Strategy Dynamics Essentials, Strategy Dynamics Ltd
Warren (2014), Agile SD: Fast, Effective, Reliable, Strategy Dynamics Ltd; Presentation to International
System Dynamics Society, Delft July 2014 https://www.youtube.com/watch?v=GKEBIIgVA1Q
Warren K (2015), Agile SD: Fast, Effective, Reliable, Strategy Dynamics Ltd
Warren K (2018), Agile system dynamics (Agile SD) for fast, effective, reliable dynamic business models, Strategy Dynamics Ltd
For information
Warren (2017a), https://www.youtube.com/watch?v=IHF6S8sRItw;
Warren (2017b), https://www.youtube.com/watch?v=NRx_05p_r8Y
ANNEX A
WHY, WHY, WHY, DIAGRAM
ANNEX B
Some names and units for resources (stocks) in LA,
and names and units for associated inflows and outflows.
| Stock / Resource | Units of Resource | Inflows | Outflows | Units of Inflows and Outflows |
|---|---|---|---|---|
| Titles | Number of titles | Land titles by initial right registration (IRR); titles created by subdivision of already registered land. | Titles extinguished. | Number of titles per month |
| Landholders with no title / rights recorded | Number of landholders | New land / property holder. | Landholders whose rights have been recorded. | Number of landholders per month |
| Landholders with title / rights recorded | Number of title / rights holders | Landholders whose rights have been recorded. | Titles extinguished. | Number of landholders per month |
| Landholders with title / rights recorded who use the LR to record subsequent land dealings | Number of title / rights holders | Title / rights holders who use the LR. | Title / rights holders who stop using the LR. | Number of landholders per month |
| Landholders with title / rights recorded who do not use the LR to record subsequent land dealings | Number of title / rights holders | Title / rights holders who do not use the LR. | Title / rights holders who switch to using the LR. | Number of landholders per month |
| Staff, in Land Agency or LR | Number of people | Hire of new permanent staff; hire of temporary staff. | Resign; dismissed; end of contract. | Number of people per month |
| Customers / users of LR services | Number of people or businesses | Person wanting to register a land transaction with the LR. | Persons whose land transaction has been registered with the LR. | Number of persons per month |
| Work to be done; applications to be processed; backlog | Number of land applications awaiting processing | Land applications submitted. | Land applications processed and completed. | Number of land applications per month |
| Land services | Number of services | New services added. | Existing services discontinued. | Number of services per year |
| Staff morale | Rating 0–1 or 1–10 | Actions that raise morale or work to maintain it. | Actions that cause a fall in morale. | Number of actions per month and their effect on morale |
| Public confidence in the LR / Land Agency | Rating 0–1 or 1–10 | Actions that raise public confidence or work to maintain it. | Actions that cause a fall in public confidence. | Number of actions per month and their effect on public confidence |
| Propensity to charge informal fees | Rating 0–1 or 1–10 | Actions that raise or maintain this propensity. | Actions that cause a fall in propensity. | Number of actions per month and their effect on propensity |
ANNEX C
Some Information on PIs (Performance Indicators)
Performance indicatorWhat the Performance isUnitsDemand SideSupply sideUsing Historical dataEstimatedStockInflowOutflowVariableBacklog (applications to be processed)Number of applications waiting to be processedN applicationXXXApplications lodgedNumber of application lodgedN application / mthXXXLR staffNumber of staff working in the LRN StaffXXWaiting timeTime that a customer waits for an application to be lodgedMonthsXXXIndividual processing capabilityProductivity of an individual to process applicationsApplications/ person / dayXXXLR processing capacityProductivity of the LR as a whole to process applicationsApplication /monthXXX
ANNEX D
PTIS FROM BRAINSTORMING
Original list of PTIs from brainstorming session
| No. | Proposals to Improve (PTIs) |
|---|---|
| 1 | Request the Treasury Department to fund more permanent staff and purchase technology. |
| 2 | Continue to only employ temporary staff, with IDA funding, to clear the backlog when it gets too high. |
| 3 | Improve15 the efficiency of LR procedures to reduce the time taken to process an application. |
| 4 | Modify some laws and regulations that are considered out of date and/or too restrictive. This PTI leads to reduced time to process an application. |
| 5 | Increase LR staff skill levels, leading to reduced time to process an application. |
| 6 | Use some combination of PTIs 2–5 above. |
| 7 | Increase the number of effective days worked per month so they are closer to the nominal days to be worked, noting that time is taken off for cultural and clan business. |
| 8 | Reduce the propensity to charge informal fees (IFF), facilitation fees or speed fees to get a particular application processed quickly and jump the backlog queue. |
| 9 | Seek to attract back to the LR the estimated approximately 30% of titleholders who do not conduct land dealings through the LR. |
| 10 | Upgrade and improve the operations of the LR so that it is closer to meeting the developed economy characteristics of an effective LR, and becomes a revenue source for government rather than a cost. |
PTIs ruled out with the reasons.
| PTI No. | Reason |
|---|---|
| 1 | The Treasury Department had made it quite clear that no extra funding would be provided until the LR could show sustained productivity improvement and an increase in fees collected. IDA funds also cannot be used to fund permanent staff. It is hoped that, with IDA assistance to implement some improvements, a sustained improvement in productivity could be demonstrated. Treasury may then be willing to consider a case to appoint more permanent LR staff and support the use of technology. |
| 8, 9, 10 | These were felt to be more appropriate for a bigger project to improve the overall operation of the LR. |
| 7 | While not fully ruled out on cultural grounds, it was thought that this could be examined as a What If. |
ANNEX E
FIRST PASS –IDA INPUTS, DURATIONS, QUANTUM OF IMPROVEMENT HOPED FOR
PTI #1- NoIDA funding/support provided
Remarks
This is not really a PTI; it is included to show the likely future POT of the backlog if no IDA support is provided. i.e. it quantifies the likely size of the backlog at any future time.
Input - Nil
PTI #2 - Continue to only employ temporary staff, with IDA funding, to clear the backlog when it gets too high
Remarks
This IDA was previously provided in the past from months ~37-50. It comprised five temporary local staff for ~12 mths or until the backlog was almost removed. PTI#2 is simply repeating this every time when the backlog reaches ~1000 applications.
The input
| Start Month or Condition | Duration Months |
No. of Temporary Staff IDA Funded |
|---|---|---|
| Initially month 100; whenever backlog reaches approximately 1,000. | 12 | 4 |
In system dynamics this is referred to as “the fix that fails”. Einstein noted – “we cannot solve problems by using the same kind of thinking we used to create them”.
PTI #3 - Improve16 the efficiency of LR procedures
Remarks
The current procedures that the LR are using were considered reasonably inefficient, not clear, or easy to follow, and in some areas, there were no written procedures, and various staff had different interpretations. It was decided to distinguish between parts of the procedures involving changes that could be approved completely within the Department, by a CEO/DG or similar, and thus implement quickly while the TA (procedures) (Technical Advisor) was on site. The TA could be either local or international. Improving procedures that involved changes to Laws or Regulations were to be addressed via PTI#4. A graphical function was used in the SD model to quantify the effect of new procedures on capability.
The input
| Start Month or Condition | Duration Months |
No. of TA IDA Funded |
Anticipated Improvement in Individual Capability |
|---|---|---|---|
| 100 | 6 | 1 | 20% |
PTI #4 - Modify some Laws & Regulations that are considered out of date & too restrictive, to further improve procedures
Remarks
It is not uncommon in developing economies for many Laws to be very prescriptive and for some of these aspects to be handled, in developed economies, administratively by regulation. In general Laws can only be changed by Parliament or equivalent, whereas the Government of the day can change regulations. Good governance requires safeguards, balance and prudence to minimize the potential for corruption.
It was decided that a TA (Laws and Regs) can examine existing laws and Regulations, consult with stakeholders, draft improvements. etc., but it is up to the Department, its Minister, the Government, and Parliament to bring recommended changes into law. It can take some time (in some cases years) for drafted changes to be passed into law and hence capable of being applied. A graphical function was used in the SD model to determine the effect of changes in Laws & Regs on capability.
Input
| Start Month or Condition | Duration Months |
No. of TA IDA Funded |
Anticipated Improvement in LR Staff Capability | Delay After TA Input Before Draft Laws / Regulations Approved |
|---|---|---|---|---|
| 100 | 6 | 1 | 50% | 24 months |
PTI #5 - Increase LR staff skills levels
Remarks
It is not uncommon for LR staff in developing economies to have low skill levels due to lack of formal structured training, and largely learning on the job by observing others. Individual skill levels may be only half of what is required for full efficiency. An input to TA to formally increase staff skills to the level required can increase individual staff capability, and hence increase overall LR processing capacity.
The task of the TA was to work with the LR staff to review job positions, duty statements, and skills held and skills necessary, and then to devise and deliver a training program to increase individual skills to the level required and then to provide on the job mentoring to build confidence and proficiency. The model provided for 1 day’s formal training per week during the presence of the TA (skills). The remaining time of the TA was to be spent on the tasks listed above, as well as the preparation of training material, and training a senior LR staff person to be able to continue the formal training and on the job mentoring, post the TA (skills). A graphical function was used in the model to determine the effect of new procedures on capability.
Input
| Start Month or Condition | Duration Months |
No. of TA IDA Funded |
Anticipated Improvement in LR Staff Capability |
|---|---|---|---|
| 103 | 6 | 1 | 30% |
PTI #6 - Some combination of PTI#2-5
Remarks
This PTI involves combining aspects from PTI#2-5. It is essentially using local temporary staff once off to assist to reduce the backlog, while at the same time using the three different TAs, to improve procedures, laws & regs, and skill levels, so that LR staff have a sufficiently increased capability to keep the backlog at a reasonable level, and do not require any future IDA in this area.
Input
| From | PTI Description | Start Month or Condition | Duration Months |
No. of Temporary Staff / TA | Anticipated Improvement in LR Staff Capability | Delay After TA Input Before Draft Laws / Regulations Approved |
|---|---|---|---|---|---|---|
| From PTI #2 | Use temporary processing staff when backlog reaches approximately 1,000. | Start month 100; whenever backlog reaches approximately 1,000. | 12 | 5 | 0% | 0 |
| From PTI #3 | Improve procedures. | 100 | 6 | 1 | 20% | 0 |
| From PTI #4 | Improve laws and regulations. | 100 | 6 | 1 | 50% | 24 |
| From PTI #5 | Increase LR staff skill levels. | 103 | 6 | 1 | 30% | 0 |
ANNEX F
SCS (schematic of core structure) of each PIP
SCSs are hand sketched as they might be from a working meeting of an in country design team
ANNEX G
A CONSOLIDATED LIST OF OBSERVATIONS FROM THE SCS AND ASSOCIATED DATA
What the WHY, WHY, WHY, diagram (Annex A) indicates: -
- That demand (applications for processing) is greater than supply (capacity of the LR to process)
- Processing capacity is low because: - productivity is low (low skills; process & workflows unclear and cumbersome); budgets are insufficient for technology)
Observations that can be drawn from the 1st Pass of the SCS Fig 4.15d)
As well as examining the SCS, it is also necessary to include the observations drawn from the POT graphs of backlog (Sec 4.4.2), and observations drawn from the Why, Why, Why, diagram (Sec 4.4.1and Annex A). The following observations can be drawn: -
- That demand (applications for processing) is greater than supply (capacity of the LR to process)
- Processing capacity is low because: - individual productivity is low (low skills; process & workflows unclear and cumbersome); budgets are insufficient for technology)
- The balancing feedback loop, the effect of wait time on titleholders leaving, can be strong (long waiting times causes titleholders to no longer use the LR). However, the two other feedback loops are very weak. The reinforcing loop, effect of wait time on staff leaving, is weak as most staff do not wish to leave a secure government job, even if the salary is low. The balancing loop, effect of wait time on management hiring more staff is very weak as Treasury Department will not provide the finance for extra staff.
These observations provide a base to compile a list of potential PIPs (performance improvement proposals). Further observations will be added in Sec 4.9.1.
Additional observation from this 1st pass of the SCS (Fig 4.15e) and Table 4.4
Following Fig 4.15d observations from the 1st pass of the SCS were drawn. To these can be added (drawn from Fig 4.15e and Table 4.4): -
- All PIPs are aimed at improving the supply side
- PIPs #2,3,4 are aimed at improving individual productivity by ~100%, and hence sustainability
- PIP#1 will assist to remove the backlog but will not contribute to sustainability post aid
- If the Laws & Regs changes (PIP#3) are not passed by Legislative body then only ~50% of the target for improved performance will be achieved, and sustainability post aid unlikely to be achieved.
4.10.4 Observations that can be drawn from the 2nd pass at the SCS (Fig 4.15f) and Fig 4.16 and Fig 4.17a, b
. Observations from the 1st pass at the SCS were listed following Table 4.4. It can be helpful, on site, to greatly enlarge the SCS and superimpose the various graphs of Figs4.16 and 2.17a,b as an aid for discussion and understanding
The following additional observations can be drawn from the 2nd pass at the SCS.
- KPIs and PIs of the system have been identified, and indicative POT graphs compiled of past performance and possible future performance with proposed aid. What drives what can be seen from Fig 4.15f
- Time 0 mth is when data can be estimated from; Time 36 mths is when the first IDA was provided, in the form of five temporary processing staff for 14 months. This IDA removed the backlog, but did not keep it low. Current time is Time 100 mths, when IDA has been again requested to remove the backlog
- There is little doubt that the backlog can be eliminated by using additional temporary staff (PIP#2) as previous aid has achieved this.
- On the supply side, individual processing capability of ~1.4 applications/person/day seems low for comparable situations and approximately 1 effective working day/ person/ week seems to be lost due to cultural and clan business. This results in a low total LR processing capacity which is less than demand, thus causing the backlog.
- Individual processing capability/productivity is THE KPI as: -
- the aim (with aid) is to basically double productivity and for that to be sustained post aid. [productivity to increase from 1.4 to 2.8 applications processed/person/day . via, improved procedures and workflow by ~20% (PPIP#3); via changes to laws & Regs by ~50% (PIP#4); via increasing skills by ~30% (PIP#5)].
- Individual productivity has a major impact on backlog, the PIO and a KPI. If productivity doubles, then LR processing capacity (supply) should approximately double, thus ensuring that supply should be greater than demand (applications lodged) for some time, thus keeping the backlog very low.
- If backlog can be kept low, then waiting time will be low, and titleholders should no longer stop using the LR because of long waiting times, i.e. feedback loop #1 will have little impact, (1st graphical function of Fig 4.17a refers)
- If the doubling of productivity can be achieved with aid, and sustained post aid, then the PIO will most likely be sustained post aid.
- Keeping the backlog low will rely on LR staff and management maintaining the processing improvements post aidthatareaimed for during the aid period.
- A serious risk is that if the Laws & Regs changes (PIP#3) are not passed by the Legislative body (hoped for ~2 years after aid finishes), then only ~50% of the target for improved performance will be achieved, and long term sustainability post aid will be unlikely to be achieved. (The effect of this risk is examined as a What If in Chapter 5).
- Building the SCS up in stages while in country will help project design members (often from diverse backgrounds and skill areas), in a group learning experience to understand the main structure and dynamics in play, and thus foster “buy in” from those in country who will be participating in the IDA project and have to live with the results, post aid.
- The 2nd pass at the SCS provides sufficient information for a 1st pass at a SD model and its use quantitatively to test the PIPs for effectiveness and sustainability (chapter 5 refers).
ANNEX G
| Abbreviation | Meaning |
|---|---|
| FBL | Feedback Loop |
| IDA | International Development Assistance |
| IRPR | Initial Recording of Property Rights |
| LA | Land Administration |
| KPI | Key Performance Indicator |
| LBM | Living Business Model |
| LIS | Land Information System |
| LR | Land Registry |
| M&E | Monitoring and Evaluation |
| PI | Performance Indicator |
| PIO | Performance Improvement Objective |
| PIP | Performance Improvement Proposal |
| POT | Performance over Time |
| SD | Strategy Dynamics |
| SCS | Schematic of the Core Structure (of the system) |
| TH | Titleholders |
Footnotes
- 1 For details of the SD methodology see Warren K (2009, 2010); or online courses at https://www.sdcourses.com/ ↩
- 2 https://www.silicoai.com/ ↩
- 3 System Dynamics was developed in the 1960s at MIT by Professor Jay Forrester; https://en.wikipedia.org/wiki/System_dynamics ↩
- 4 https://online.visual-paradigm.com/knowledge/problem-solving/why-why-diagram-for-root-cause-analysis/ ↩
- 5 in some jurisdictions the LR may only cover privately owned land/ property; where there is a separate Registry of government land, and where some of that land is leased, the same importance applies to the government land registry. ↩
- 6 The modelling software Silico was used to illustrate the Figs in this section ↩
- 7 Conducting land/property transaction outside of the LR is a real option in developing economies where sellers and buyers may see little advantage in going through a LR. Winning back to the LR those who do not use the LR is examined in Chap 9. ↩
- 8 This effect is examined when incorporating feedback loops into the model in Sec 4.7.1 ↩
- 9 Capacity is the number of applications that the LR staff as a whole can process; it is expressed in application/month. ↩
- 10 Capability (or productivity) is the individual ability to process an application expressed in applications/person/day; it depends in part on the skills level of the individual, work flows, procedures, and supporting technology ↩
- 11 The mechanics shown use the Silico software ↩
- 12 https://www.sdcourses.com/ ↩
- 13 The term Performance Improvement Proposal (PIP) is used for any idea that is put forward to improve an existing situation/ system. ↩
- 14 https://www.sdcourses.com/ ↩
- 15 improvements here will be limited to those that can be carried out using the authority of the Director General of Lands and Registrar of Titles or equivalents and thus approved and implemented fairly quickly ↩
- 16 improvements here will be limited to those that can be carried out using the authority of the Director General /Registrar of Titles or equivalent ↩