CHAPTER 7
Using the SD MODEL as a LIVING BUSINESS MODEL
to MANAGE the PROJECT and for M&E (Monitoring and Evaluation)
7.0 Introduction
7.1 Possible different perspectives on M&E by the major stakeholders
7.1.1 Possible perspective of an international development agency
7.1.2 Possible perspective of the in country agency
7.2 Using the SD Model as a Living Business Model to Manage the project
7.2.1 Identifying the PIs and KPIs (Performance Indicators and Key Performance Indicators)
7.2.2 Using the SD Model to manage
7.2.3 Using the SD Model to fix a problem
7.2.4 Take home points
7.3 Using spreadsheets for M&E cf to using the SD Model
7.3.1 Using spreadsheets for M&E
7.3.2 Why using the SD Model as a LBM provides a deeper and fully analysis & supports action
7.3.3 Fostering sustainability
7.4 Some other aspects
7.4.1 M&E indicators for the logframe
7.4.2 Effective days worked
7.4.3 The necessity for routine M&E
7.5 Key Points
Tables
7.1 PIs (Performance Indicators) for M&E
7.2 Management evaluation at month 5 – half way through the project
7.3 Management evaluation at month 10 – the end of IDA support
7.4 Management evaluation at month 22 – 12 months after the end of IDA support
7.5 Management evaluation at month 22 (when using spreadsheet rather than SD model)
Figures
7.1 Past and desired future POT for backlog (the performance objective); hand sketched at early design
7.2 Target future POT for backlog, based on the improvement strategy and computed by the SD model
7.3 An image of the cut down SD model to be used to manage the project
7.4 Causal dependency from backlog
7.5a POT graphs for KPIs/PIs at month 5 – half way through the project
7.5b Performance traffic lights at month 5 – half way through the project
7.6a POT graphs for KPIs/PIs at month 10 – the end of IDA support
7.6b Performance traffic lights at month 10 – the end of IDA support
7.7a POT graphs for KPIs/PIs at month 22 – 12 months after the end of IDA support
7.7b Performance traffic lights at month 22 – 12 months after the end of IDA support
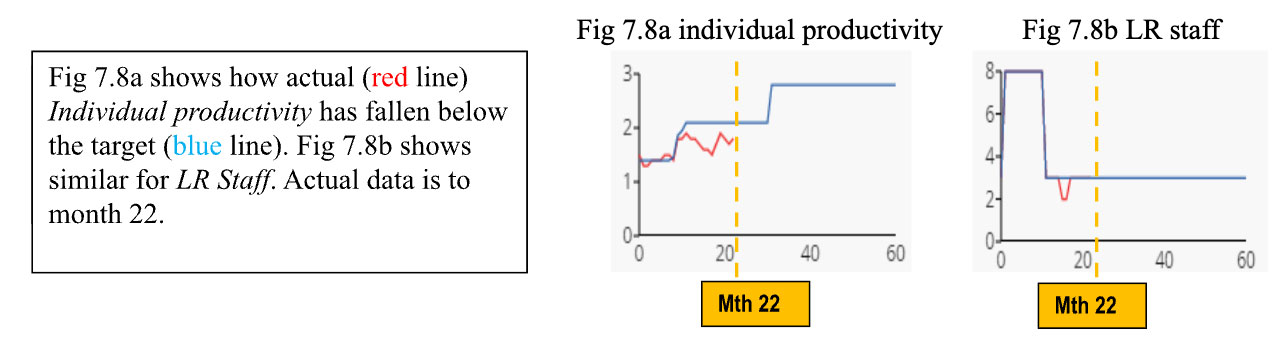
7.8a Individual Productivity: actual to mth 22, and target
7.8b LR staff: actual to mth 22, and target
7.9a Individual Productivity: revised target from mth 23 on
7.9b LR staff: revised target from mth 23 on
7.10a Backlog: calculated revised target from mth 23 on
7.10b Applications processed: calculated revised target from mth 23 on
7.10c LR processing capacity: calculated revised target from mth 23 on
7.11a Applications lodged cf LR processing capacity – from mths 0 to 22
7.11b Applications lodged cf LR processing capacity – from mths 23 on with revised performance targets
7.12a Backlog at mth 22 (when using spreadsheet)
7.12b Applications processed at mth 22 (when using spreadsheet)
7.12c Applications lodged at mth 22 (when using spreadsheet)
Annexes
A. Abbreviations used
CHAPTER 7
Using the SD MODEL as a LIVING BUSINESS MODEL
to MANAGE the PROJECT and for M&E (Monitoring and Evaluation)
7.0 Introduction
What M&E is and the need for it
M&E (Monitoring and Evaluation) is an integral part of IDA (International Development Assistance) projects. It is the process of tracking and evaluating progress towards the achievement of outputs, objectives and impacts, and to identify where, when, and what change may thus be necessary.
No matter how good an improvement strategy, an IDA project design, or an implementation plan are, they will most likely be based on incomplete information, and an incomplete understanding of the situation on the ground. There will always be unforeseen aspects, situations will change, and adjustments will be necessary during project implementation, and post project.
Indicators for M&E are included in the logframe of a project, and a more detailed M&E plan is usually developed early in project implementation, and used during the project. M&E should be continued post project, by the IC (in country) Agency to assist managers to manage.
Using the SD model as a Living Business Model (LBM)
A LBM provides the means, Warren K (2020), to:-
- Determine if a plan will work
- Design a system so that it can perform well
- Manage the system so that it does perform well
- Fix the system when problems occur
Chapters 4, 5 and 6 showed how the SD model can be built and used to design improvements to the system. This chapter will show how the SD model can be used to manage the system and fix the system if problems occur
The Purpose of this chapter is to:-
- Indicate the different perspectives that major stakeholders may have on M&E
- Show how the SD model can be used as a LBM to assist to manage the project during IDA, and post IDA
7.1 Possible different perspectives on M&E by the major stakeholders
The two major stakeholders in an IDA project are the ID agency, which generally provides a significant amount of the project funds, and the IC agency where the project is being conducted. The IC agency is intimately involved in implementation, and lives with the results. These main stakeholders may have different views on M&E based on current practice, needs, what is deemed important, and their capability to conduct M&E, and for managers to manage using the results.
7.1.1 Possible perspective of an International Development (ID) agency
Current practice, needs, importance
Different ID agencies will have their own policy, requirements and procedures for M&E. In general, there will be a mandatory requirement to monitor such things as:-
- How the planned schedules of inputs and expenditure are progressing, compared to actuals
- What the progress is to achieve the planned outputs
- How well actual objectives/impacts are being achieved, compared to design objectives/ impacts1
- That grant or loan funds are being spent according to agreed plans and protocols
Capability
To meet the above requirements, an ID agency will generally require a robust M&E plan. A large project will generally require specialised M&E staff whose costs will be a particular line item in the IDA project budget. Carrying out M&E during the IDA project, is generally no problem for the project team, using project funds,
As the IDA agency will have its own requirements and procedure, these will not be considered further.
7.1.2 The possible perspective of the In Country (IC) agency
Current practice
LRs (Land Registries) in developing economies tend not to be highly focused on tracking performance (productivity), and hence little systematic data tends to be collected and used by management. The reasons for this can be: low annual O&M (Operation & Maintenance) funding which does not allow sufficient LR staff time to collect the necessary data; senior management do not require M&E of performance/ productivity; LR staff do not have sufficient skills to design or use M&E; M&E is often not seen as that important and a bit of a luxury.
Change would be necessary to introduce appropriate M&E, for it to become institutionalized IC, and sustainable as a routine operational tool.
Data that may be routinely recorded
In some jurisdictions a Presentation Book or similar is used in the LR. This is often required by legislation. A presentation book or similar records data such as:- date/ time documents lodged; who lodged by; type of transaction; date finalized. It is generally possible to easily extract:-
- Number and type of applications lodged/month
- The backlog
- Applications processed/month
More time consuming, but still relatively easy to extract are:-
- Indicative waiting times
Adages re workflow/procedure improvements and data collection
A rule of thumb for workflow and productivity improvement is that anything not seen to be used or important, and which requires additional work, is unlikely to be sustainable, especially when budgets and resources are constrained.
Needs
The needs of an LR could be to:-
- See a clear reason to do and use M&E
- Have a simple system that can work, given the LRs limited resources
- Have the capability to use the simple system for managers to manage
7.2 Using the SD Model as a Living Business Model to Manage the project
7.2.1 Identifying the PIs and KPIs (Performance Indicators and Key Performance Indicators) to Monitor (The M of M&E)
The performance improvement objective of the first backlog example
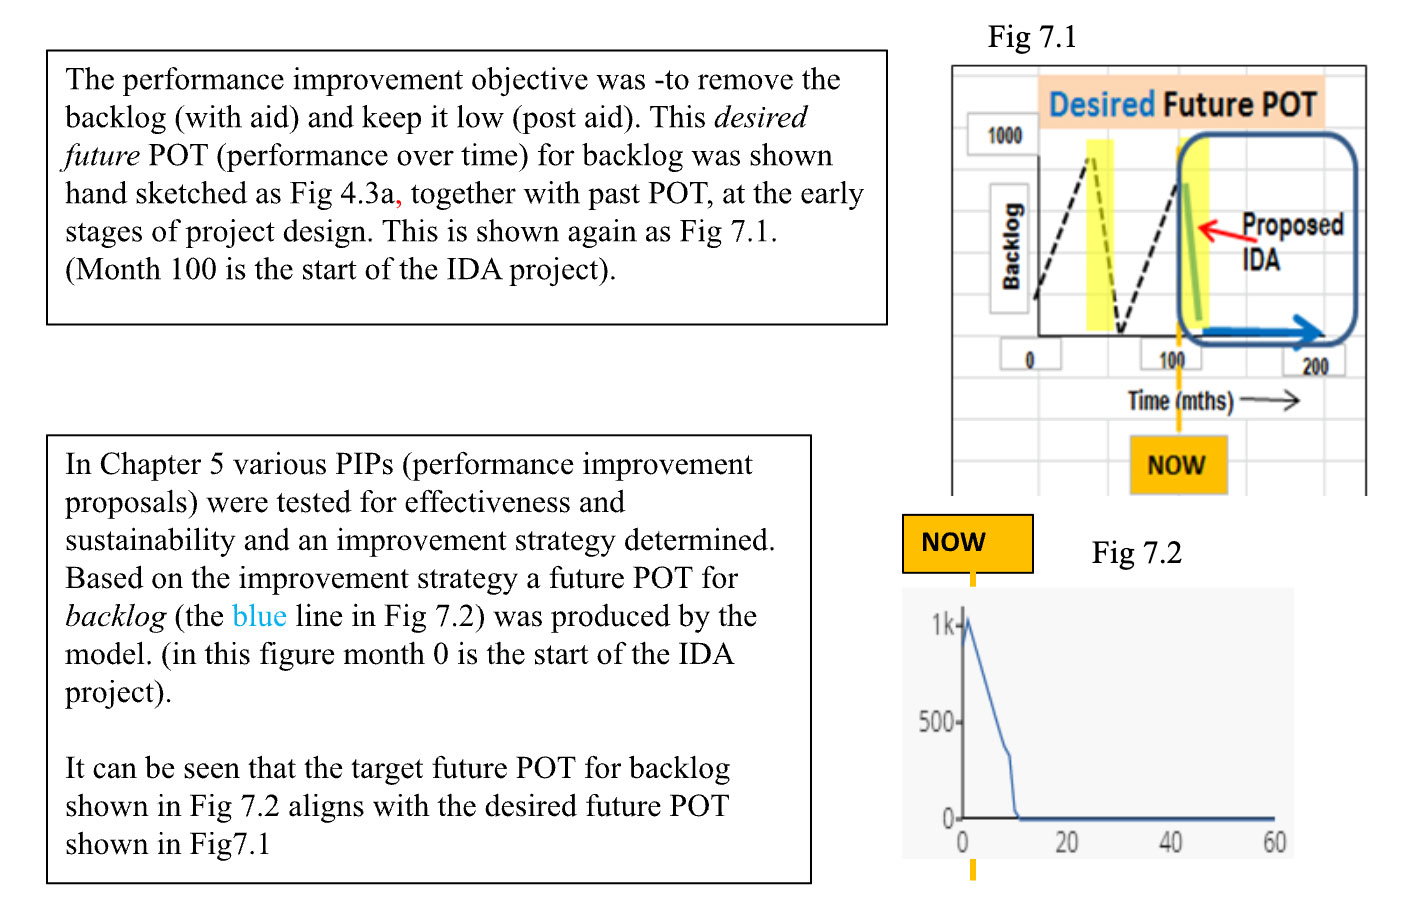
An SD model commencing at the start of the project
The SD model used for design in Chapters 5 and 6 included past performance, all the PIPs to be tested with their individual on/off switches and input details, as well as the project financials. All this detail is not needed to manage the project as the improvement strategy has been determined. Hence a stripped down model was produced. This model starts at month 0 when the IDA project starts, and runs for 60 months. IDA support is only provided for the first 10 months.
An image of this model is shown at Fig 7.3. Fig 7.2 was generated from this model.
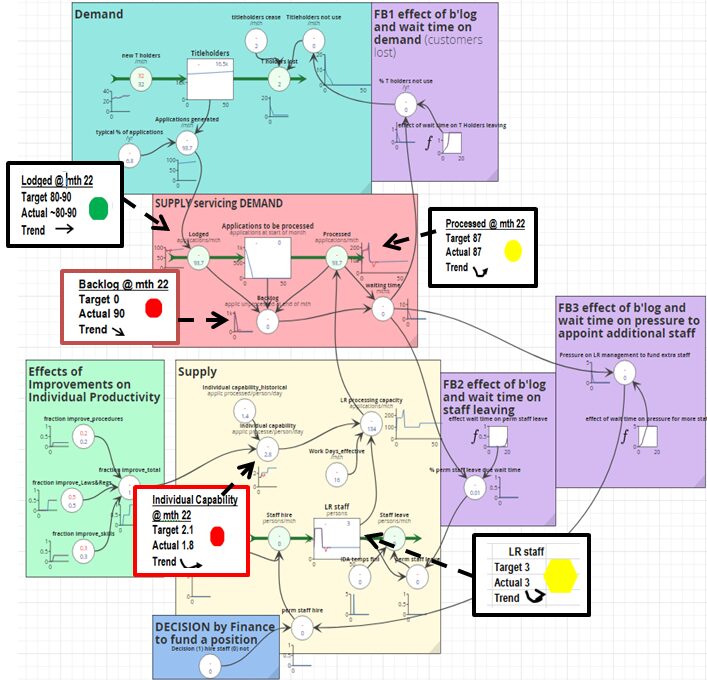
Fig 7.3
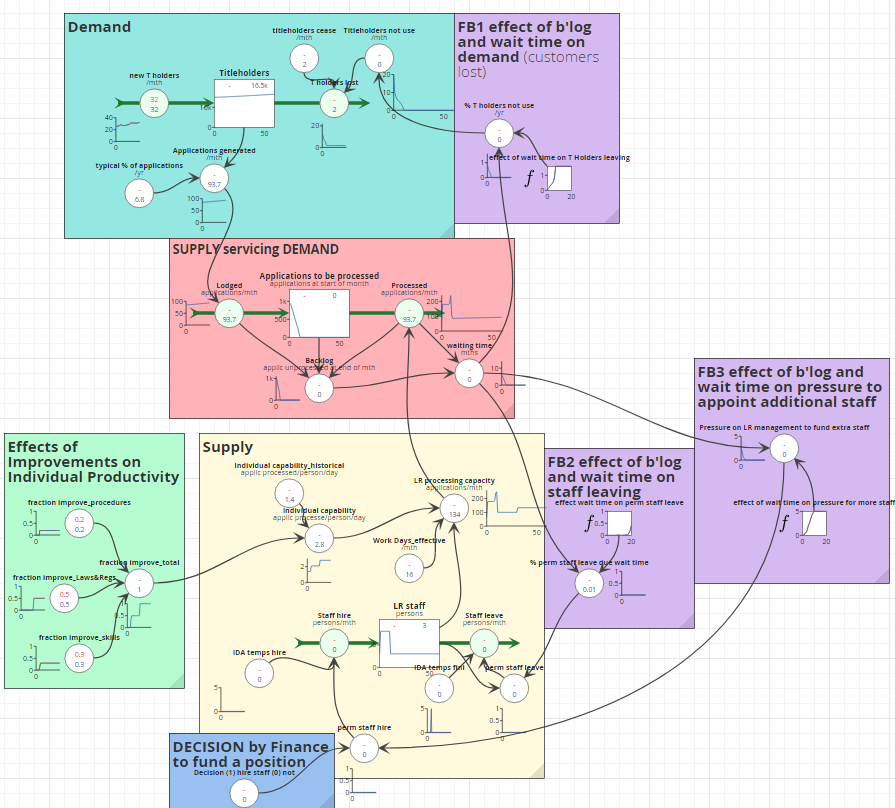
Points on Fig 7.3
- The blue lines beside each variable and in/out flow, and inside each stock, give future POT (performance over time) as input to the model as initial values, and /or as computed by the model
- The anticipated improvement effect (magnitude and commencement time) is shown beside each improvement fraction. e.g. an improvement of 0.2, due to improvements in procedures and work flow, commences at month 9.
What drives what?- the chain of causality for the performance improvement objective, backlog
Sysdea modelling software has a feature, dependency2, that allows a variable in the model to be selected, and when dependency is applied the model shows a trace of all that causes the selected item, and all that is dependent on it. Fig 7.4 shows a dependency trace when backlog is selected.
Fig 7.4
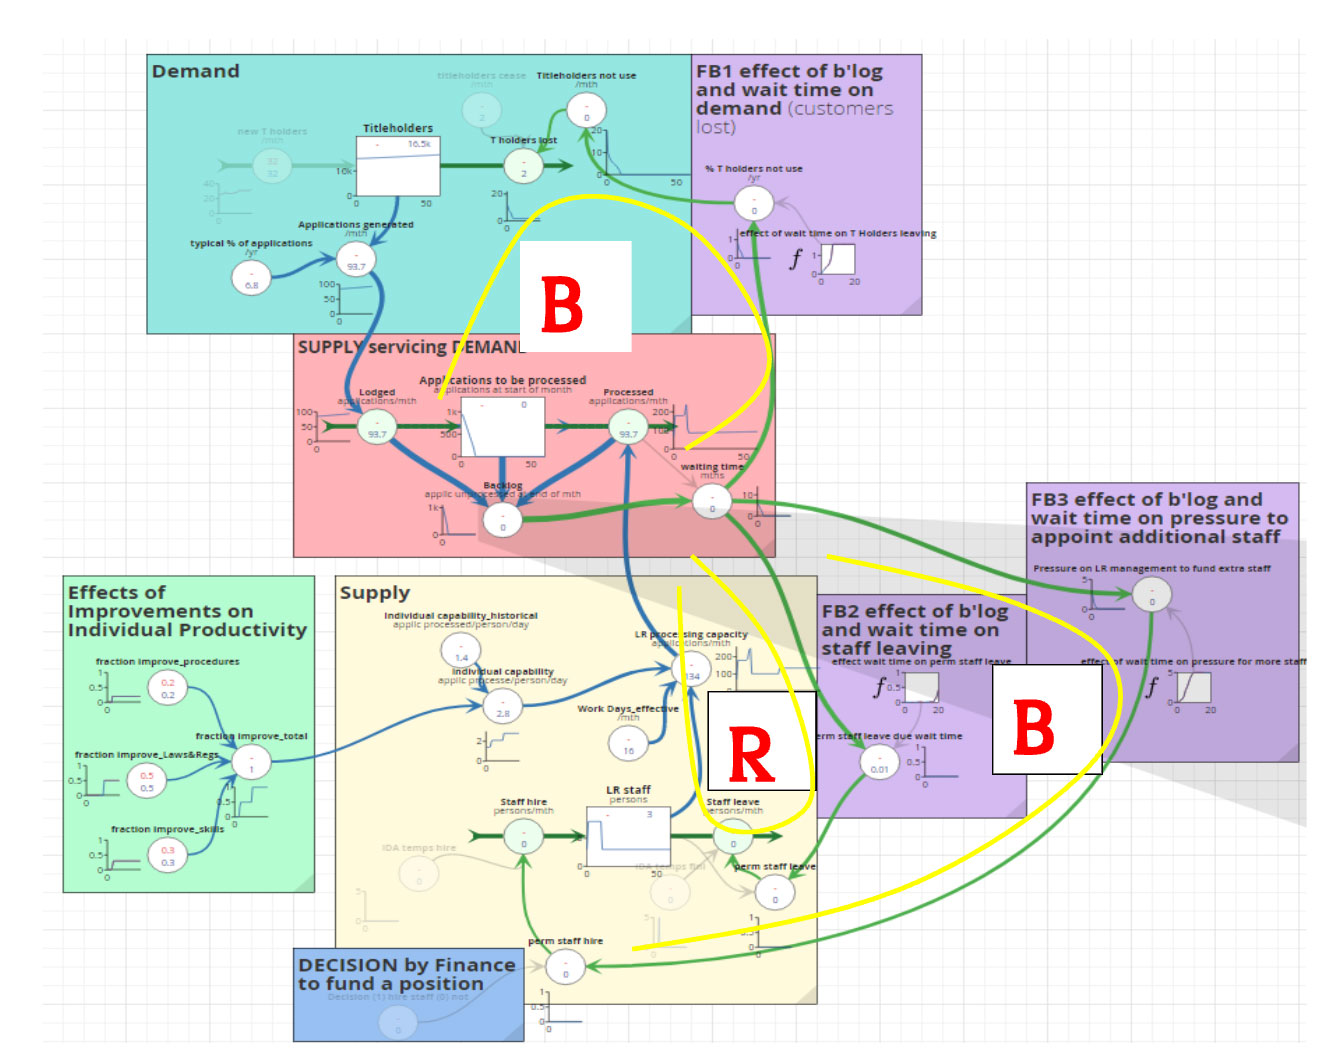
Points on Fig 7.4
- The blue lines show the causal link to backlog. The lines decrease in thickness the further down the causal chain. The green lines show what is dependent on backlog.
- The identification of dependence highlights the three feedback loops, shown by yellow lines. One is reinforcing (R) the other two are balancing (B); these were discussed in Sec 4. 7.
The causal links to backlog are:-
- The stock, applications to be processed, its inflow, applications lodged, and its outflow, applications processed
- The inflow, applications lodged, is dependent on the stock, titleholders and the applications they generate that are then lodged in the LR. This is influenced by the top balancing (B) feedback loop, which causes a loss in titleholders who use the LR when waiting time for processing is too long
- The outflow, applications processed, is entirely dependent on the variable, LR processing capacity, which is dependent on three sub paths:-
- The stock, LR staff, and its inflow and outflow [it was noted in Chapter 4 Sec 4.71 that the IC finance department would not consider funding any additional staff until there was some indication of improved productivity, and also that staff leaving was rare as working in the LR was considered a secure government position]
- The variable, work days effective. [It was noted in Chapter 4 Annex B that about 1 day /person/week was lost due to strong clan and extended family responsibilities, and that this would not be examined further at this time]
- The variable, individual capability, which in turn depends on the effects of three PIPs
In the next sub section, the causal dependency path will be used to identify PIs (Performance Indicators) and KPIs (Key Performance Indicators).3
Identifying PIs (Performance Indicators), KPIs (Key Performance Indicators) and what real world data to collect
In identifying PIs, it is necessary to recall the following:-
- If stocks do not change, performance does not change [SD Principle #2 Sec 4.5]
- Stocks can only change if flow rates (in & out of stocks) change [SD Principle #3 Sec 4.5],
- Flow rates are driven by existing stocks, causing feedback, and are affected by delays, internal organisational decisions and external factors [SD Principle #4 Sec 4.7].
Applying the above to the causal links to backlog allows the identification of PIs, and the real word data that needs to be collected (on a monthly basis in this illustrative example), so that actuals can be compared to performance targets. Table 7.1 refers.
Table 7.1
| Indicator / Objective | How Determined | Units |
|---|---|---|
| Performance Improvement Objective | ||
| Backlog | Counted | Applications |
| Performance Indicators (PI) | ||
| Applications lodged | Counted | Applications per month |
| Applications processed | Counted | Applications per month |
| LR staff working | Counted | Number at post per month |
| Individual capability / productivity | Calculated as applications processed actual / LR staff working actual. | Applications processed per person per day |
The KPIs are:-
- Backlog -the PIO (performance improvement objective)
- Individual capability -the prime factor to achieve the PIO. [a major IDA effort is on the doubling of individual productivity by improving processing procedures and work flows. improving laws & regs, and significantly improving staff skills]
For the purpose of this example, data on KPIs and PIs was collected monthly, entered into the model and used to track actual performance compared to target performance, as shown below.
7.2.2 Using the SD Model to manage – i.e. using the model as a LBM (living business model)
This section illustrates how the SD model can be used by managers to manage. Section 7.2.3 shows how to fix problems as they arise.
Three time periods have been used for illustrative purposes:-
- at month 5- half way through the IDA
- at month 10 – at the end of IDA
- at month 22 – 12 mths after the end of IDA
[NB- operationally this would be done monthly at least- these three periods were used to illustrate where there was a change between actuals and targets].
At month 5- half way through the IDA support
Fig 7.5a shows the POT graphs for each KPI/PI extracted from the SD model.
Fig 7.5a
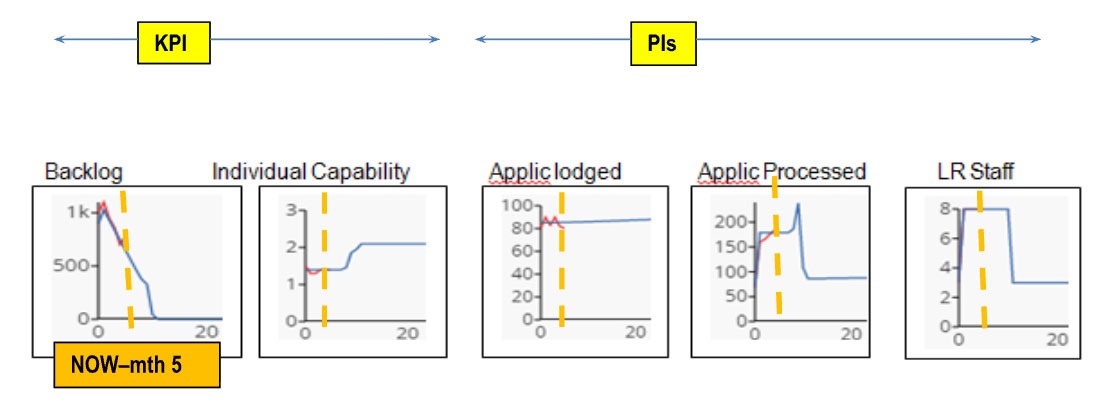
At the end of each time period POT graphs for each KPI/PI have been extracted from the model.
- The real world values (in red) tell what performance actually is, and how changing
- The model values (in blue) indicate what performance should be (i.e. targets)
Fig 7.5b shows performance summary boxes superimposed on the model.
Fig 7.5b
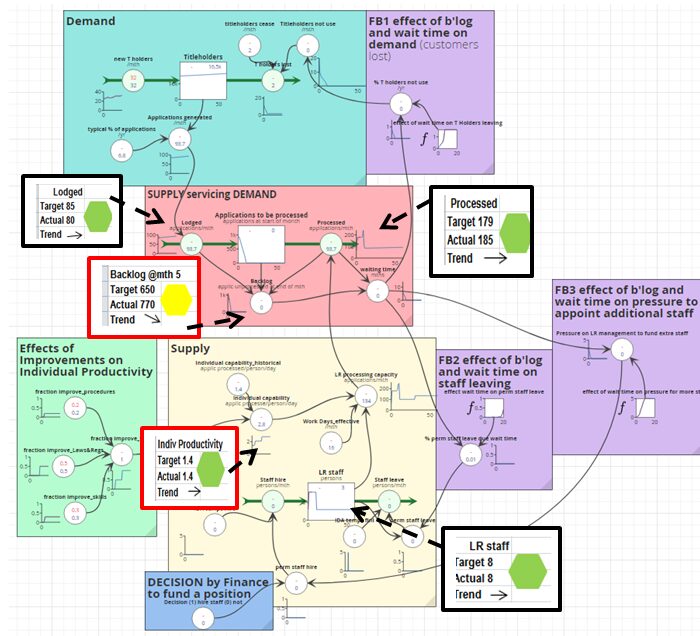
From the POT graphs of Fig 7.5a traffic lights are shown in a performance summary box beside the KPI/PI in an image of the model (Fig 7.5b). A green traffic light indicates OK; yellow indicates caution; red indicates that management attention is required. The arrows indicate trends i.e. how performance is changing. The summary boxes with a red border are KPIs, and the ones with black borders are PIs.
What the KPIs/PIs tell managers (summarized in Table 7.2)
Table 7.2
| Time | Conclusions from KPI / PI Graphs | Management Action |
|---|---|---|
| Month 5 | Largely on track. One yellow light: backlog actual is not meeting target, but the trend shows a large reduction in backlog. Applications processed are on target, applications lodged are as anticipated, and the start has been slower than anticipated. | Keep an eye on the backlog to make sure it continues reducing significantly. |
At month 10- at the completion of IDA support
Fig 7.6a POT graphs
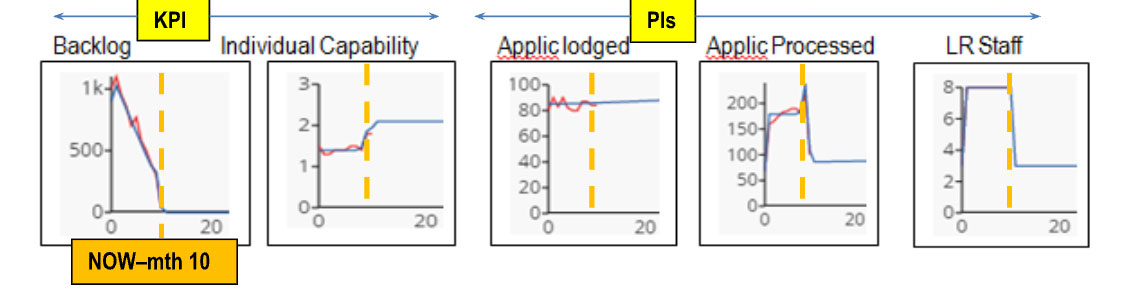
Fig 7.6b Summary performance boxes of KPIs & PIs
What the KPIs/PIs tell managers (summarized in Table 7.3)
Table 7.3
| Time | Conclusions from KPI / PI Graphs | Management Action |
|---|---|---|
| Month 10 | On track. The backlog has been removed. Individual productivity has significantly improved, as shown by the anticipated number of applications processed being reached. Applications lodged show some up and down variations from what was anticipated. | Nil. |
At month 22- 12 months after the end of IDA support
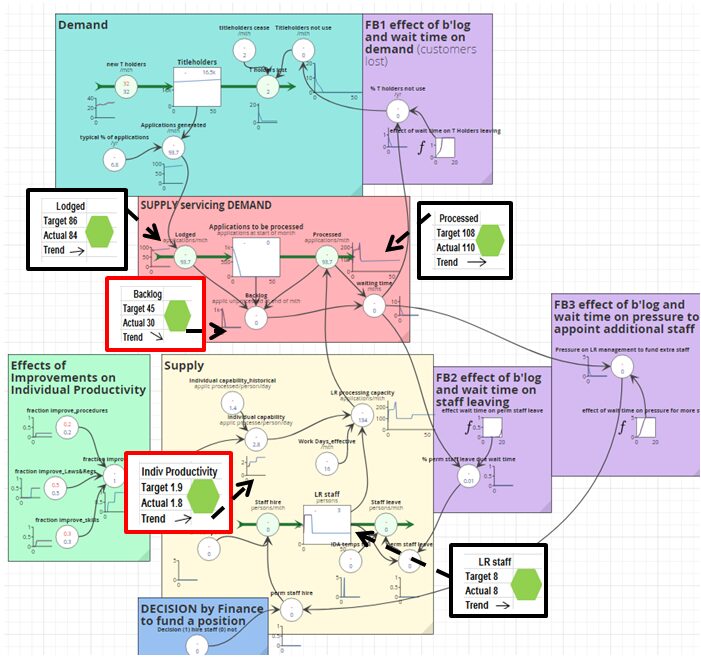
Fig 7.7a POT graphs
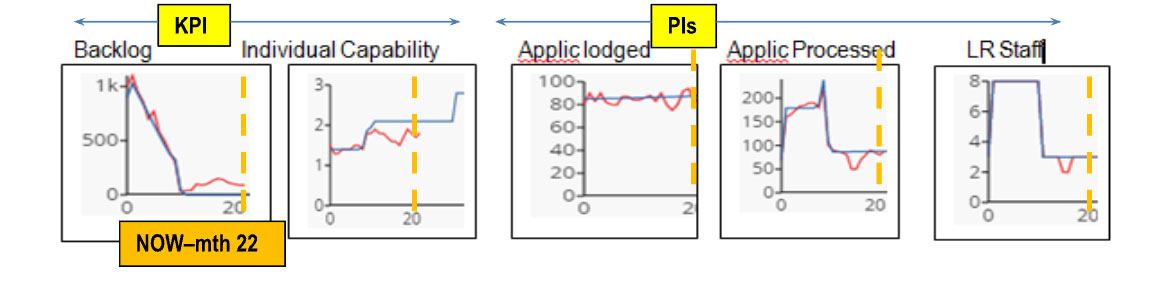
Fig 7.7b Summary performance boxes of KPIs & PIs
What the KPIs/PIs tell managers (summarized in Table 7.4)
Table 7.4
| Time | Conclusions from KPI / PI Graphs | Management Action |
|---|---|---|
| Month 22 |
|
|
Points re Fig 7.7a,b and Table 7.4
- This is an example of where management action is needed to fix the problem. [The next section 7.2.3shows how the SD model can be used as a LBM (Living Business Model) to fix the problem.]
- Operationally it would be hoped that post an IDA project, regular M& E would continue regularly.
- Management, on carrying out Actions 1 to 6 found that:-
- The new procedures and workflows were not being fully implemented so follow up training was carried out, as was closer supervision
- Time lost due to clan duties was found to be as anticipated and no action was necessary
- The current target for individual productivity was probably a little high and should be reduced from 2.8 to 2.6 applications /person / day after all the improvements kick in
- When staff are absent for some time without pay, their salary savings could be used to hire temporary processing staff
- Action 7 requires revised performance targets for the KPI backlog, as the performance target for the KPI, individual productivity is to be reduced. The next section will show how this can be done.
7.2.3 Using the SD Model as a LBM (living business model) to fix a problem
Fig 7.8a individual productivity Fig 7.8b LR staff
There is a need to:-
- set revised performance targets for Individual productivity and LR Staff, from month 23 on, and then
- calculate revised POT/targets for backlog (the performance objective), and other quantities that are causally connected to Individual productivity and LR Staff. Causal connections were shown in Fig 7.4.
- Setting revised future performance targets (from mth 23 on)
Fig 7.9a individual productivity Fig 7.9b LR staff
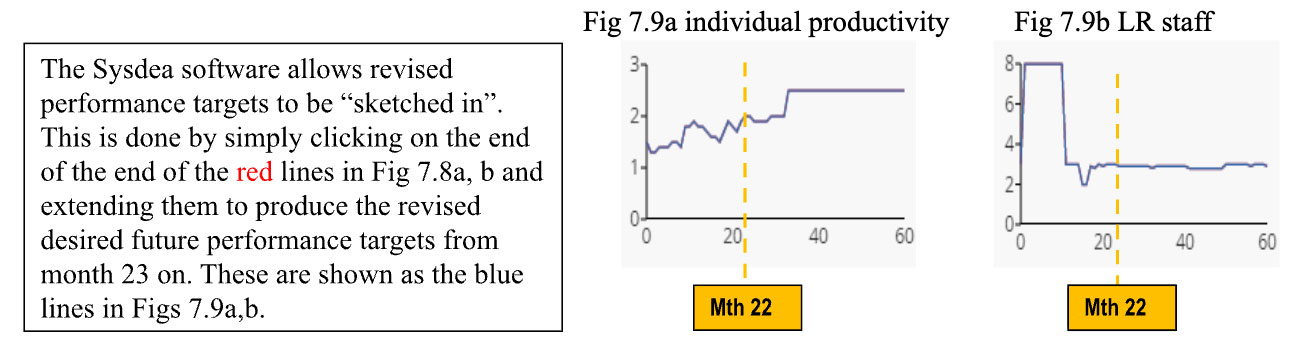
Figs 7.9a, b show revised performance targets for Individual productivity and LR Staff respectively from month 23 on. NB: individual productivity is a KPI of the system, while LR staff is a PI.
In Fig 7.9a the trajectory for individual productivity from month 23 has a lower numeric trajectory than previously and results from:-adopting a final target of 2.6 applications processed/person/day, (rather than the original of 2.8); and reaching it 3 three months later; reducing the factor of improvement due to improved Laws & Regs from 0.5 to 0.3.
In Fig 7.9b the slight unevenness in the LR staff trajectory from month 23 on is due to “sketching by mouse”, rather than numerical data entry.
- Calculating revised future POT/targets for backlog (the performance improvement objective), (from month 23 on)
Fig 7.10a backlog Fig 7.10b applic processed Fig 7.10c LR proc capac
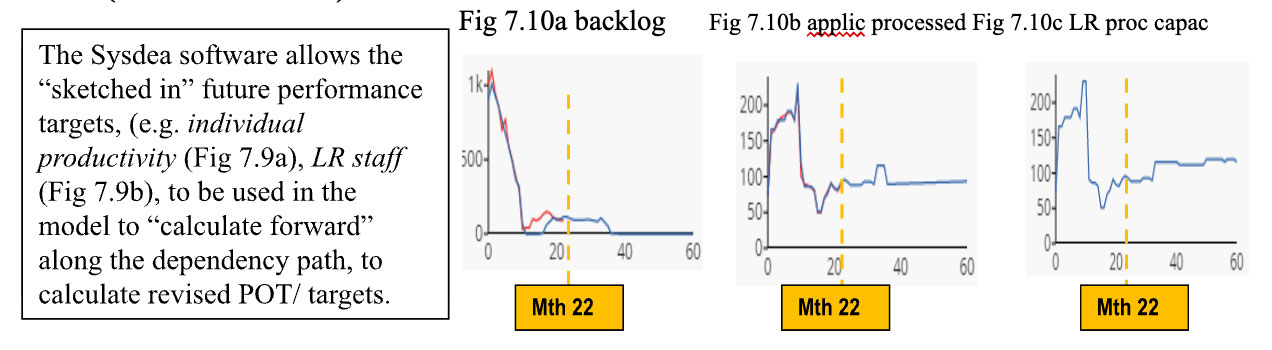
Fig 7.10a shows the revised POT/target for backlog, (the PIO). This indicates that at now (the start of month 23), that the backlog is anticipated to return to zero again in mth 37. [at month 12, the backlog was zero, and at design it was anticipated that the backlog would remain at zero].
Fig 7.10b shows a revised POT/target for applications processed, a PI of the system. Fig 7.10c, included for interest, is the revised POT of the variable, LR processing capacity
7.2.4 Take Home Points
- from this “fixing” the problem example
- it is possible to use the SD model as a LBM (living business model) to produce logically based transparent revised performance targets as necessary
- from illustrating the use of the SD model as a LBM (living business model)
- It is quick and easy to incorporate the monthly “actuals” into the model, produce a status summary and traffic light for each KPI and PI (e.g. Fig 7.7), and for managers to produce a “What the KPIs and PIs tell managers” (Tables 7.3. 7.4)
- Doing the above is of no use, unless managers :manage” by carrying out the management actions (Table 7.4), including producing and acting on revised performance targets
- From a M&E (monitoring & evaluation) perspective
- Using the model to highlight the improvement objective and the systems KPIs/PIs and causal dependency, allows an easy identification of data to be collected monthly, while ensuring that the focus is firmly kept of “what tells us about the performance of the system”, viz, the trajectories of the KPIs and PIs, and for how well (or not) actual data is aligning to targets
- About the system
Fig 7.11a and b show the comparison between applications lodged (the red line) and LR processing capacity (the blue line) for two periods. Fig 7.11a is for the period from project start to month 22, and Fig 7.11is from month 23 on where a revised (lower) target was set for individual capability/ productivity, and resultant revised targets were computed for backlog and LR processing capacity.
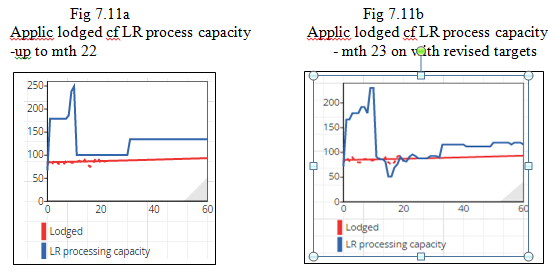
It can be seen that LR processing capacity has a reduced target and that demand (applications lodged) is closer to supply (LR processing capacity) in Fig 7.11b.
The following general comments can be made:-
- The system (in this example) is finally balanced. The LR from month 23 on has just sufficient capacity to processes the anticipated applications lodged and maintain a very low backlog. The LR can remove a small increase in backlog, but if not removed fairly quickly (say over 3 months), the backlog could grow and be very difficult to remove solely using LR resources
- Backlogs can quickly grow quite large if-
- Individual productivity drops below target for any length of time
- LR staff are absent for other than short periods
- If applications lodged are greater than anticipated for a medium time period (perhaps 5 months)
- Managers/supervisors need to be vigilant in conducting regular comparisons of target to actuals (at least monthly and perhaps weekly for some time) and then to take quick management action
7.3 USING SPREADSHEETS FOR M&E cf to using the SD Model
The section above showed how the SD model can be used to manage the LA improvement undertaking, and fix a problem, once identified. This is using the SD model as a LBM (living business model).
Spreadsheets are commonly used for M&E. The following sub section will comment on this, and then look at the pros and cons of using spreadsheets, compared to using the SD model.
7.3.1 Using spreadsheets for M&E
Spreadsheets are commonly used to hold collected data on performance indicators (PIs), and to track performance trends over monitoring intervals, commonly monthly or quarterly. If spreadsheet graphing was being used for the “removing the backlog, and keeping it low” example used in Section 7.2, then the graphs of actual cf target at month 22 would be similar to those shown in Fig 7.12.
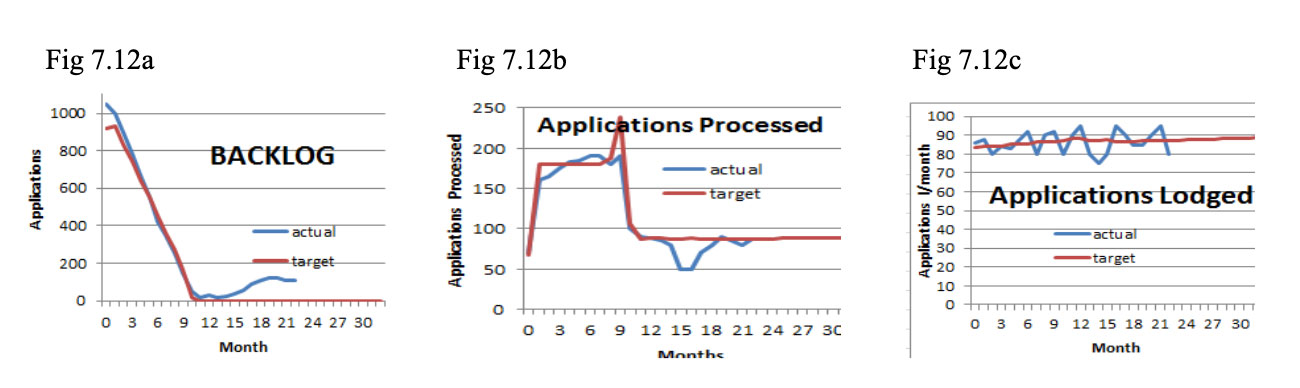
There are two less PIs above than identified and used when using the SD model in Sec 7.2. The PIs not used here are LR Staff, and individual productivity. The reason they are not included is because the improvement task was not considered as a system. The PIs in Fig 7.11 are fairly obvious and actual data on applications lodged was routinely collected in the Presentation Book (Sec 7.1.2 refers).
Table 7.5 shows the conclusions that could well be drawn, and the management action to be taken.
Table 7.5
| Time | Conclusions | Management Action |
|---|---|---|
| Month 22 |
|
|
A comparison of Table 7.5 above with Table 7.4 (resulting from using the SD model) indicates that more detailed conclusion can be drawn from Table 7.4, and the management action is fuller and more precise. In Table 7.4 it was possible to immediately identify that:-
- individual productivity had been falling for some time and a future lower target was probably necessary, supported by refresher training in the new procedures and skills
- a single LR staff member had been absent for two months, but was back
- revised performance targets from month 23 on were required
Sec 7.2.3 indicated how revised performance could be determined, and what they were.
Conclusion - Deeper, fuller and quicker analysis and management action is possible using the SD model, than using spreadsheets for M&E.
7.3.2 Why using the SD Model as a LBM provides a deeper and fully analysis & supports action
The reasons can be summarized as follows:-
- A clear depiction of causality, an understanding of the dynamics in play, and identification of KPIs and PIs (Table 7.1) is provided by a system’s model with a dependence trace on the PIO (performance improvement objective) (Fig 7.4).
- Managers are assisted to manage by the provision of numerics on performance from the POT graphs of the KPIs/PIs, together with the use of traffic lights and performance summary blocks (Figs7.5-7.7). Conclusions can be drawn and management action recommended (Tables 7.2-7.4).
- Revised performance targets can be quickly determined and deployed (Figs 7.9, 7.10)
- All operations and information are contained in the one SD model which can be used at various points of time, for a variety of purposes.
7.3.3 Fostering sustainability
A case can be made for a small amount of IDA to be provided post IDA project to support M&E and management action, using the SD Model. Without sustainability of the improvements achieved during the project, the project investment will decay over time.
Since M&E tends not to be embedded in LRs in developing countries, a strong case can be made for periodic regular support (much support could be online) to embed M&E, and to assist managers to manage using the results. Using the SD model and the traffic lights summary has the advantage that aids focus on the performance of the KPIs & PIs, which are relatively few in number.
7.4 Some other aspects
7.4.1 M&E indicators for the logframe
The KPIs and PIs in Table 7.1would be suitable for inclusion in a logframe as verifiable indicators. An ID agency will include PIs that cover other aspects (e.g. gender) (Sec 7.1.1 refers). An indicative logframe for this backlog example is shown in Chapter 8 Sec 8.3.1.
7.4.2 Effective days worked
The actual days worked /person/per month used in both the full and the simplified model (Fig 7.3) is 16. The nominal days that should be worked are 20. It was noted that, on average, it appeared that 1 day /person /week is lost to absence due to extended family and clan responsibilities which have a high cultural priority.
The increase in processing productivity, if this absence could be reduced, was examined as What If #4 and the results shown in Section 5.5.2 and Fig 5.7.
It was determined that this absence would not be considered until the effects of productivity improvements due to improved procedures, work flow and upskilling were clear. The effect of reducing absenteeism could be examined using the SD M&E model shown in Fig 7.3.
7.4.3 The necessity for routine M&E
This example uses the SD model to demonstrate how it can be used effectively for M&E, and as a living business model to:-
- Clearly understand, using the dependency trace, what is causing what at points in time
- Setting revising performance targets for key KPIs and thus generate revised future POT targets for dependent KPIs and PIs
If (in this example) M&E had been conducted every month after project completion, then at about month 12 it should have been noticed that individual productivity was ~1.9 and 1.8 in months 11 and 12 respectively, compared to the target of 2.1 (actuals cf to targets were quite close during execution of the project), and that this was causing the backlog to slowly increase. Action could have been taken at month 12 to examine the reasons for this and to set in place the necessary management action, rather than picking it up 10 months later, as shown in the above example.
Also, if M&E had been conducted every month, then the long term absence of one staff member would have been identified in month 15, and a policy for the temporary replacement of staff during a long absence could have been then formulated, and approval sought for a temporary replacement.
7.5 KEY POINTS
- M&E (Monitoring and Evaluation) is essential to measure the progress being achieved (actuals compared to targets), and to modify plans and targets if necessary.
- There will probably be different needs, perspectives and capability for M&E between an ID (International Development) agency focusing on the project period itself, and the IC (In Country) executing agency which may focus more on the post project period.
- The SD model, used to test for efficacy in design and to identify the strategy for improvement, can also be used very effectively as a LBM (living business model) for M&E. Using traffic lights for the KPIs and PIs, provides a clear focus to assist managers to manage.
- If an ID agency were to continue some periodic /on call support (remote or onsite) for M&E, then the continued use of the SD model for discussion on the progress towards outcomes/impacts would be quite valuable, as would the setting of revised future targets, when necessary.
References
Warren (2020), Living Business Models, Strategy Dynamics Ltd
Warren (2019), Segment 8.5 Models, Policies and Key performance Indicators (KPIs) in Dynamic Business Modelling Course, Extension Frameworks, Strategy Dynamics Ltd https://www.sdcourses.com/
ANNEX A
| Abbreviation | Meaning |
|---|---|
| IC | In-Country |
| ID | International Development |
| IDA | International Development Assistance |
| KPI | Key Performance Indicator |
| LBM | Living Business Model |
| LR | Land Registry |
| M&E | Monitoring and Evaluation |
| O&M | Operations and Maintenance |
| PI | Performance Indicator |
| POT | Performance over Time |
| PIP | Performance Improvement Proposal |
| SD | Strategy Dynamics |
| SCS | Schematic of the Core Structure |
Footnotes
- 1 However a significant amount of impact may not occur until some years post IDA ↩
- 2 Dependency trace was a feature in the Sysdea software which was used in this example. Sysdea has been replaced by Silico software and the dependency trace is anticipated to be available as a feature shortly. ↩
- 3 In Chapter 4 Sec 4.10.1 it was shown how PIs and KPIs could be identified from the SCS (schematic of the core structure). Using the dependency trace is another ways of identifying PIs and KPIs. ↩