CHAPTER 6
PROJECT FINANCIALS and EVALUATION
6.0 Introduction
6.1 Showing the SCS (schematic of core structure) for the Financials and Evaluation Sector
6.2 Project Costs – once off
6.3 O&M Costs – annual recurring (responsibility of the in country agency)
6.4 Revenue to Government- with and without the project
6.4.1 Fees charged by an LR
6.4.2 Revenue Flows to Government – with the project
6.4.3 Revenue Flows to Government – without the project
6.4.4 Increase in Revenue Flow to Government due to the project
6.5 Project Evaluation
6.5.1 Project evaluation - financial
6.5.2 Project Evaluation - Comparing LR annual recurrent O&M costs to revenue collected
6.5.3 Project Evaluation - Non direct financial considerations
6.5.4 Summary- Project evaluation
6.6 Is the Project worth investment consideration?
6.6.1 From the perspective of the land agency/host country
6.6.2 From the perspective of a developed country providing IDA costs as a grant
6.6.3 From the perspective of a development bank providing IDA costs as a loan
6.6.4 The 1st order assumptions
6.6.5 Summary– is the project worth investment?
6.6.6 Important point
6.7 Key Points
Tables
6.1 (in Annex A) IDA funded costs
6.2 (in Annex A) Project costs estimation
6.3 Project cost
6.4 Assumptions used in revenue calculation
6.5 Revenues flow to government - with project
6.6 Revenues flow to government - without project
6.7 Increased revenue flow to government due to project
6.8 Ratio revenue to O&M costs – with project
6.9 Surplus revenue less O&M costs - with project
6.10 Ratio revenue to O&M costs – without project
6.11 Surplus revenue less O&M costs - without project
6.12 Improvement in ratio revenue to O&M costs – due to project
6.13 Improvement in surplus revenue less O&M costs - due to project
Figs
6.1 The SCS for financials (costs, revenues) and evaluation
Annexes
A. Project costs
B. Some examples of values of revenue variables
C. Some Notes on Cost Benefit Analysis (CBA)
D. Abbreviations used
CHAPTER 6
PROJECT FINANCIALS and EVALUATION
6.0 Introduction
An improvementstrategy to remove the processing backlog in the LR (Land Registry) (with aid) and to keep it low (post IDA) was determined in Chapter 5 where a number of PIPs (performance improvement proposals) were tested for effectiveness and sustainability.
The purpose of this chapter is: -
- Show the SCS (Schematic of the Core Structure) for the model sector for financials and evaluation
- Use the expanded SD model to: -
- Calculate the once off project costs
- Calculate the annual recurring O&M (operation & maintenance) costs to the in country (IC) agency
- Calculate the revenue flows to Government with and without the project
- Calculate the ratio of revenue to O&M costs, and the surplus of revenue over O&M costs with and without the project
- Examine the merits of proceeding with the project
This chapter will not go into the detail of extending the SD model for the financials but will use the results from the model.
6.1 Showing the SCS (schematic of core structure) for the Financials and Evaluation Sector
Figure 6.1 shows the SCS for the financials and evaluation sector. It has been added to the SD model of Fig 5.1.
Fig 6.1
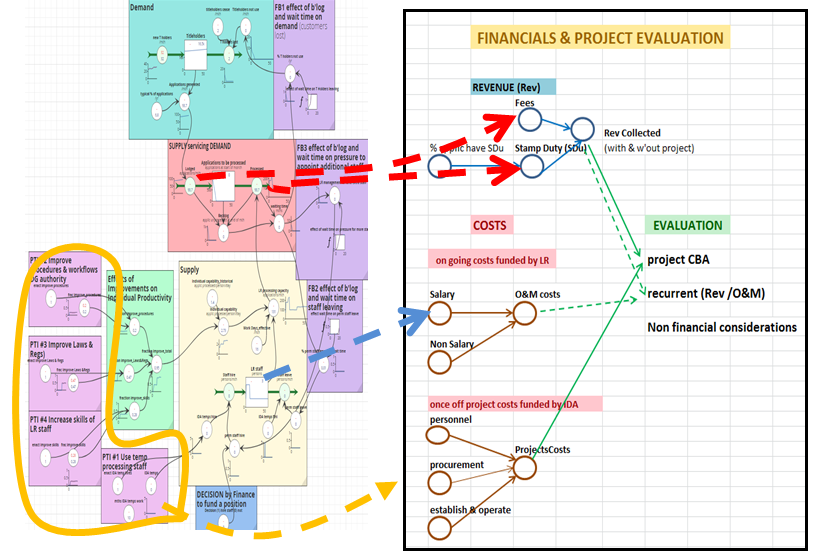
The thick red dashed lines show where revenue flows from. The thick blue dashed lines show where recurring costs for O&M flows from. The orange dashed lines show where once off project costs flow from.
Some brief comments on each of the subsections follow. The purpose of the following is to give an overview. More comments on the resultant calculations are provided in the indicated subsections.
The Subsector of Project Costs
Project costs are once off and essentially depend on the quantum of inputs, input durations and associated unit costs. The project commences when the first input of technical assistance (TA) commences in mth 100 and is completed when the input of TA finishes in mth 110, giving a project duration of 10 mths. Project costs are totally met by IDA.in this example. Sec 6.2 provides detail. Project costs. [project cost = inputs x unit costs]
The Subsector of O&M Costs of the LR
O&M costs of the LR are annual and ongoing. Budget is provided to the LR by the IC treasury department. The red dashed line in Fig 6.1depicts the link between permanent LR staff (in the supply sector) and O&M costs. [O&M costs = N permanent LR staff x salary costs x a factor for non-salary costs]. Sec 6.3 provides detail.
The Subsector of Revenue to the Government collected by the LR
The amount of revenue collected by the LR is dependent on: -
- the number of applications submitted to the LR by the title holders who use the LR
- fees paid on lodgement of the application
- the stamp duty (tax) that may be payable on certain types of transactions, e.g. property sales Stamp duty is paid just before finalisation
The red dashed line in Fig 6.1 depicts the link between applications lodged (in the demand sector) and revenue collected by the LR. [fees collected = N applications lodged x application lodgement fee]. Stamp duty paid = N applications lodged x % stamp duty paid x property value]; revenue collected = fees collected + stamp duty paid].
It is necessary to calculate revenue with and without the project to determine the improvement in revenue collected due to the project. Sec 6.4provides detail. The revenue without the project is calculated by simply “switching off” the PIPs in the SD model.
The Project Evaluation Subsector
The following aspects are examined: -
- A financial evaluation of project costs to revenue improvement (Sec 6.2.1)
- A comparison of revenue to O&M costs (sec 6.2.2)
- Non-financial considerations (Sec 6.2.3)
- Summary of project evaluation (Sec 6.2.4)
- Is the project worth investment consideration (Sec 6.7)
6.2 Project Costs – once off
Project costs are once off. Typically, the great majority of these are IDA funded, with a small amount funded by the in country (IC) agency.
IDA funded costs
For this illustrative backlog example it is assumed that IDA will fund the items shown in Annex A, Table 6.1. The order of magnitude of unit costs is shown, together with numbers of personnel, their input durations, as based on the improvement strategy for removing the backlog and keeping it low. (Chapter 5 Sec 5.4 refers).
NB-The unit costs and input types and durations in Table 6.1 of Annex A are there for ease of reference only. They are embedded in the SD model in the sector that deals with costs and revenues. A significant advantage of the SD approach is that in the SD model, strategy and financials are completely integrated. For example, if a change is made to strategy (e.g. to increase the duration of a particular TA), then the change in financials is instantly apparent. All of the figures in the following tables were computed in the SD model.
In Country (IC) Agency funded costs
For this backlog example it is assumed that the in country agency does not have to contribute financially. It could be argued that the time that LR staff spent working with the TA and attending skills upgrading is a cost as it takes them away from their normal duties. Such costs are small compared to IDA funded costs, and for the sake of simplicity have not been included
Total Project Costs (once off) - estimation
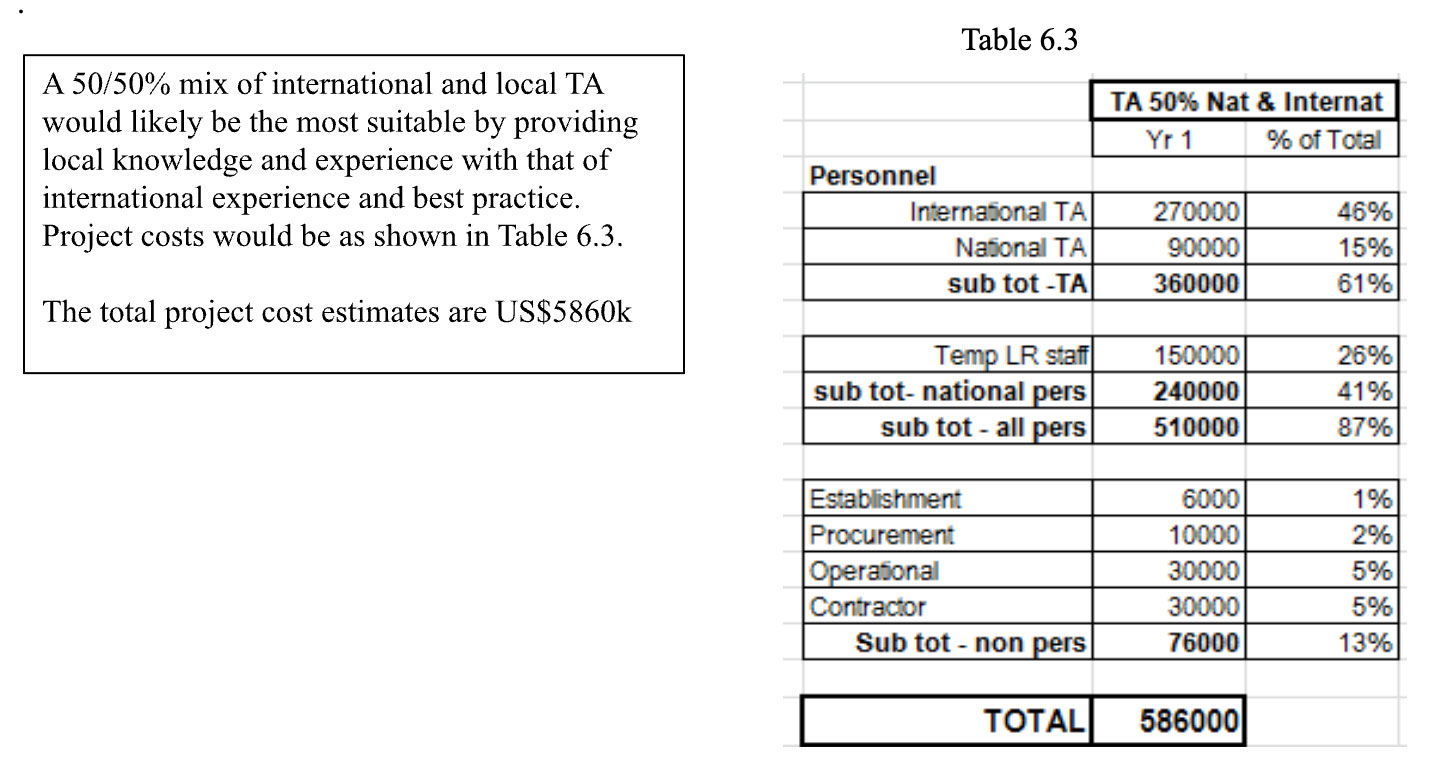
Total project costs are shown in Annex A, Table 6.2. These are a summary from the SD model. It shows the results if all TA are international, or all national, or a 50/50 mix. The SD model allows the mix of international and national to be chosen. Comments are shown in Annex A at the bottom of Table 6.2
.
Table 6.3
6.3 O&M Costs – annual recurring (responsibility of the IC agency)
All O&M costs are annual and recurring and are the responsibility of the IC agency. These include any additional annual recurring costs arising from the project. In this example any IDA project expenditure that will generate additional O&M costs to the IC agency has been kept to the bare minimum and is assumed to be zero.
It is common in developing economies for O&M costs to cover mostly salary costs, and for there to be only a small amount for non-salary operational costs. In this backlog example the formula used to calculate annual LR O&M costs was [O&M costs = Number of permanent LR staff x salary cost/person x a factor of 15% for non-salary costs].
Annual O&M cost of the LR, from project commencement (month 100), were calculated from the SD model to be ~US$8.6k/mth (~$43k local currency).
[In Chapter 9 a more complex example set in an LR includes increased O&M costs as a result of an IDA project and how this increase may be financed.]
6.4 Revenue to Government from the LR- with and without the project
6.4.1 Fees charged by an LR
There are generally two types of fees charged by a LR: -
- An applicationfee, paid on all applications on lodgement,
- Stamp duty (a tax), paid just before finalisation. Stamp duty is typically only charged on applications which involve the purchase/sale/transfer of a property and is typically calculated as a certain % of the value/sales price of the property.
Assumptions used in revenue calculation
Assumptions made in this backlog example, to keep it simple and illustrative, are shown in Table 6.4.
Table 6.4
| Assumption | Value |
|---|---|
| The percentage of titleholders who use the LR | 70% |
| The number of applications lodged per year as a percentage of titleholders who use the LR | 7% |
| There is the same application fee for all types of applications1 | $50 |
| The number of applications that involve property sales and therefore attract stamp duty is a percentage of the applications lodged | 6% |
| The average property sale price | $20k |
| The stamp duty charged as a percentage of the sale price | 5% |
$ in Table 6.3 are US$; 1 US$ ~ 5 local $
Some of the values listed in Table 6.4 can vary markedly in different countries, and between developed and developing countries. See Table in Annex B.
6.4.2 Revenue Flows to Government – with the project
With the project, is the implementation of PIP#6 (Chapter 4, Table 4.2, Sec 4.9 refers); the strategy for improvement is listed in Sec 5.4, with the likely future trajectories of the PI (performance indicators) for PIP#6 are shown in Chapter 5, Fig 5.7.
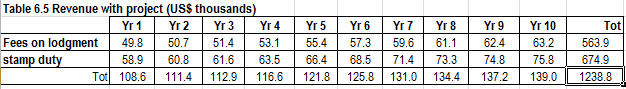
The annual revenue flow to the LR with the project is shown in Table 6.5 and has been extracted from the SD model.
Table 6.5
6.4.3 Revenue Flows to Government – without the project
Without the project the status quo continues, i.e. the processing backlog, already large, will continue to grow, and the waiting time will continue to increase. This is the base case, where no IDA support is provided; it is PIP#1. (Chapter 4, Table 4.2, Sec 4.9 refers. The likely future trajectories of the PI (performance indicators) for PTI#1 are shown in Chapter 5, Fig 5.7.
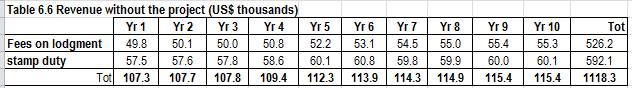
The annual revenue flow to the LR, without the project, is shown in Table 6.6 below, and has been extracted from the SD model.
Table 6.6
6.4.4 Increase in Revenue Flow to Government due to the project
The increase in revenue is largely due to the earlier payment of stamp duty (which is paid just before finalisation). The earlier payment is possible due to the elimination of the long waiting time for processing finalisation by the removal of the processing backlog. There is little change in lodgement fees, with or without the project, as these are paid on application lodgement.
The annual increase in revenue due to the project is shown in Table 6.7 below and is the difference between Tables 6.5 and 6.6.
Table 6.7
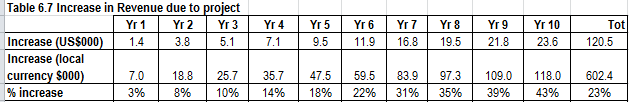
Conclusion re revenue flows
The project will provide an increase in revenue to the government of US$120k ($600k in local currency) over a 10 year period, an increase of 23%. In later years the increase is ~4%/year. [With the project, 10 year revenue is US$1.24m (local currency $6.20m), and without US$1.12m (local currency $5.60m].
6.5 Project Evaluation
Three aspects need to be examined: -
- a financial evaluation of the proposed IDA project
- an examination of the recurring annual O&M costs of the LR, compared to the annual revenue collected by the LR
- non direct financial considerations
6.5.1 Project evaluation - financial
Cost benefit analysis (CBA) is a standard approach for conducting a financial evaluation of a project. It seeks to identify the costs of carrying out the project and the financial (tangible) benefits that flow from doing the project. A number of financial criteria are commonly used (Annex C refers).
Project Costs - These are US$586k and all occur in year 1 (Table 6.3).
Project financial Benefit - The improvement in revenue flow over the 10 year period is US$120k (Table 6.7).
Financial Evaluation
With project costs of US$586k giving a benefit of improved revenue flow of US$120k over the 10 years, it is obvious that the Benefit to Cost (B/C) Ratio is much less than 1. There is therefore little point in doing a formal CBA, discounted cash flows, calculating NPV (net present value), and financial ratios.
The improvement in revenue flow over a 20 year period would be ~US$400k. This would still not cover project costs. One consideration could be to reduce project cost to achieve a B/C ratio of just over 1, but requiring a 20 year period, for a relatively simple productivity improvement, seems a long time. Also significantly reducing project costs could well risk the achievement of project objectives.
In development, sustainability of improvements post project is vital. This can take time and cost to achieve and also require consideration of non-direct financial factors (Sec 6.6.3 refers).
Conclusion re Project Evaluation – financial - The project fails a formal CBA, and therefore it is necessary to look at the other aspects of project evaluation.
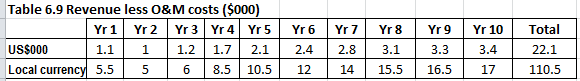
6.5.2 Project Evaluation - Comparing LR annual recurrent O&M costs to revenue collected
Useful indicators of LR operational efficiency is the ratio of annual revenue collected by the LR to the annual O&M costs of the LR, and the difference between revenue collected and LR O&M costs. The calculations for these are shown in the SCS of Fig 6.1 and are embedded in the SD model.
With the project
Table 6.8 shows the ratio of revenue to O&M costs, and Table 6.9 shows the surplus of revenue over O&M costs, both for with the project.
Table 6.8
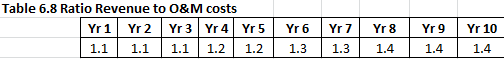
Table 6.9
Without the project
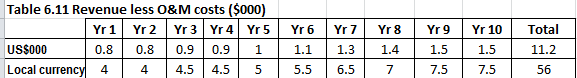
Table 6.10 shows the ratio of revenue to O&M costs, and Table 6.11 shows the surplus of revenue over O&M costs, both for without the project.
Table 6.10
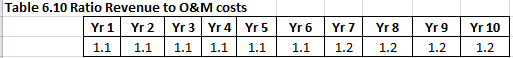
Table 6.11
Difference due to the project
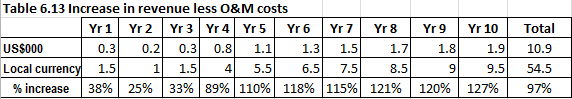
Tables 6.12 and 6.13 show the improvements due to the project.
Table 6.12
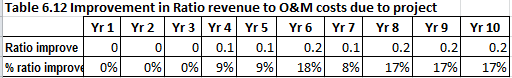
Table 6.13
Comments
- Without the project the ratio of revenue to O&M cost is just >1.
- The value of the ratio of revenue to O&M costs varies considerably between jurisdictions (see Annex B Table 6.5) and largely depends on if fee revenue only is counted, or if stamp duty (tax) is also included.
- The project produces an improvement in the ratio from year 3, increasing to a 17% improvement in Year 10. Also there is an increase in revenue less O&M costs of 38% in year 1, increasing to 127% in Year 10. Over the 10 year period this surplus to government is ~US$11k ($55k local currency).
Conclusion re Project Evaluation - Comparing LR annual recurrent O&M costs to revenue collected
With the project, annual revenue, compared to annual O&M costs, increases considerably.
6.5.3 Project Evaluation - Non direct financial considerations
These non-direct financial benefits essentially flow from having a much shorter and sustained application processing time. The benefits that flow from the reduced waiting time can be considered under the headings of:- customers, public confidence, World Bank ranking, IDA providers.
Customerswill be “happier” with greatly improved service times. Titleholders who use the LR are less likely to join those who do not use the LR. Titleholders who do not use the LR may consider using the LR.
Public confidence in the LR is likely to increase and could lead to increased perceptions of tenure security over time.
World Bank ranking for transferring a property2 is likely to significantly increase, thus sending a signal to business that the operations of the LR have significantly improved, and investments that involve land may be worth favourable consideration.
IDA providersarelikely to see reduced sustainable waiting times as a good indicator of project success and be willing to consider further larger IDA investment to improve LA. A larger project might be improving the data integrity and record completeness of the LR coupled with improving its operational efficiency and effectiveness (Chapter 10 refers). This in turn could establish the base for projects involving large scale initial land titling, or further development/improvement in the LA operational entities of Land Valuation and Land Tax, Land use and Management, Municipal information. (Chapter 2, Fig 2.1 refers).
Effects if 30% of titleholders who do not use the LR could be attracted back – There would be two major effects: - (a) an increase in revenue; (b) an increase in coverage, quality and currency of the land records in the LR.
The increase in revenue (both for fees and stamp duty) over a 10 year period would be US$708k ($3.5m local currency). This is substantial. It represents an incentive to consider ways to attract this missing 30% back to using the LR. Some relatively small increase in cost would occur due to increased O&M costs. Attracting back titleholders who do not currently use the LR is examined in Chapter 9.
An increase in coverage, quality and currency of the land records - Having an LR with reliable, current, high quality land records of all titled land in its jurisdiction is a necessary but not sufficient condition for an efficient and effective LR. The effects of increasing the quality of the LR are examined in Chapter 9.
Effects when the land market develops over time – When the land market develops further it can be expected that property prices would rise, and hence the revenue from stamp duty will increase. If the average property sale price was to double (to US40k), then the revenue collected would also approximately double. This gives an indication of the potential long term revenue benefits to government, if the land market develops. A requirement would be an effective LR. This is examined in Chapter 9.
Conclusion re Project Evaluation - Non direct financial considerations- There are a number of good non direct financials reasons for considering the project.
6.5.4 Summary- Project Evaluation
- Conclusion– financial - The project fails a formal CBA; thus it is necessary to look at the other aspects of project evaluation.
- Conclusion - Comparing LR annual recurrent O&M costs to revenue collected- With the project, annual revenue, compared to annual O&M costs, increases considerably.
- Conclusion - Non direct financial considerations -There are a number of good non direct financials reasons for considering the project.
6.6 Is the Project worth investment consideration?
The funding of an IDA project can be a grant (a gift, no repayment necessary), generally from a single aid donor in a developed country for small projects (like this example) or for medium sized projects.
For large projects the funding may be a loan from a development bank with a low interest rate and a very long time for repayment. Some large projects may be a combination of a loan from a development bank and a grant from a donor country.
The project can be considered from different perspectives: - that of the land agency/host country; that of a developed country providing IDA costs as a grant; that of a development bank providing IDA costs as a loan.
6.6.1 From the perspective of the land agency/host country
The perspective would probably be quite different if the IDA funding was a grant, rather than a loan.
IDA costs are met by a grant
Since there are no direct costs incurred by the in country land agency, and the project is anticipated to achieve a considerable improvement on the existing status quo, the project would probably be fairly attractive to a minister and senior management responsible for the land agency and the LR
The anticipated improvements are: -
- a ~ doubling in LR processing capability; (a ~30% increase in individual staff skills, and a ~70% increase from improved procedures and work flow)
- the backlog and waiting time are essentially eliminated
- a 23% increase in revenue flow over a 10 year period, with the increase being ~4%/year in later years
- net revenue (annual revenue collected less annual LR O&M costs) increase significantly (~40% in year 1, to 130% in year 10
- the intangible benefits listed in Sec 6.6.3
IDA costs are a loan and has to be repaid
The project as a narrow standalone project is not financially viable (Sec 6.7.1 refers), and a minister, senior lands management and finance department would probably not see much merit in the project if it required a loan and repayments. An expanded project scope may provide more attractive financials. (Shown in Chapter 9).
6.7.2 From the perspective of a developed country providing IDA costs as a grant
Since the project costs are small (in aid terms) and the time frame is short (just under 1 year) an aid donor might consider this as a suitable project since the project would most likely be attractive to the land agency/host country as a grant.
If the aid donor were considering much larger and longer support to improve land administration, this project could be a good Stage 1. It would determine if the project outputs can be achieved in the 1 year of the project and, more importantly, determine if over the two years post project, the backlog and waiting time remained very low. If this was achieved, it could be an indicator to consider a greater investment in a broader project such as aiming to improving the efficiency and effectiveness of the LR as a whole. Increasing the quality of the LR and attracting back titleholders who do not currently use the LR is examined in Chapter 10.
The importance of the LR in its own right was covered in Chap 2. The LR, as well provides the records depository for large scale initial land titling, and the development of upstream LA operational entities, such as the systems for Land Valuation and Land Taxation, Land Use and Management, Municipal Information and Management.
6.6.3 From the perspective of a development bank providing IDA costs as a loan
This small example project of removing a backlog in an LR is likely to be considered too small for a development bank. A follow on much larger project may be of interest to a development bank.
6.6.4 The 1st order assumptions
There are three 1st order assumptions. The first two are explicit and transparent and quantified in the SD model. The third is implicit. The assumptions are: -
- That the improvements in procedures will result in a 70% processing productivity improvement; that necessary legal changes will be made within 2 years; that individual skill will be increased by 30%
- That the backlog will be removed before IDA finishes
- That the LR staff will accept and apply the revised procedures and skills. (This can be tracked via M&E and the SD model used to set revised performance targets if necessary- Chapter 7 refers).
6.6.5 Summary – is the project worth investment?
An evaluation of the IDA project indicated that it might well be attractive to a host country and a donor country where the IDA costs are a grant rather than a loan, and where the project was considered as Stage 1 for a larger project to improve land administration, conditional on the backlog from Stage 1 being kept low for two years post Stage 1.
6.6.6 Important point
This backlog example is simple and illustrative. The important point
- is not the particular numbers used or the particular numbers that result,
- but rather the application of the SD methodology, that is quantitative, transparent with no hidden assumptions, and that can be applied during design, to test the effectiveness and sustainability of performance improvement proposals before funds are committed for implementation.
6.7 KEY POINTS
-
A financials (costs and revenue) and evaluation sector was added to the SCS (Schematic of the Core Structure) and the SD model extended, thereby enabling calculations of once off project costs, recurring O&M costs, and revenues flows, with and without the project.
-
Project evaluation was carried out considering financial and non-financial factors. An important point is that any change in one part of the model (e.g. changing the duration of a TA) immediately causes a change in all other relevant parts (e.g. project costs).
-
For this illustrative example of removing a processing backlog in the LR and keeping it low, an evaluation indicated that it might well be attractive to a host country and to a donor country, where the IDA costs were a grant rather than a loan, and where the project was considered as Stage 1 for a larger project to improve land administration, conditional on reductions to the backlog and processing times proving sustainable.
-
The important point:
-
is not the simple illustrative example, or the particular numbers used, or the particular numbers that result,
-
but rather the application of the SD methodology, which is quantitative, transparent, with no hidden assumptions, which can be used early in the design process, to test performance improvement proposals for effectiveness and sustainability, before funds are committed for implementation.
-
References
Burns T, C Grant, K Nettle, A Brits, K Dalrymple (2006), Land Administration Reform: Indicators of Success, Future Challenges, Land Equity International
ANNEX A
PROJECT COSTS – once off
IDA funded costs
Table 6.1 IDA funded costs
| Cost Category | Description | Number | Duration | Unit Cost (order of magnitude) |
|---|---|---|---|---|
| Personnel | ||||
| Technical Advisors (TA) | If international: professional fees, accommodation, per diems and travel expenses. If local: professional fees. |
3 | 6 months each TA | International: $30k/month Local: $10k/month |
| Temporary local LR staff | Salary and allowances. | 5 | 10 months each person | $3k/month |
| Establishment | ||||
| Establishment costs | Any once-off costs, such as hiring and equipping a small office. | — | — | $6k |
| Procurement | ||||
| Procurement costs | Any relatively small items of equipment, hardware, software or minor works needed in the LR to improve processing efficiency. | — | — | $10k |
| Operational | ||||
| Operational costs | Costs incurred per month during the life of the project to ensure the project runs smoothly. This may include local travel, office expenses, project expenses, training room hire and similar costs. | — | Monthly during project life | $3k/month |
| Contractor | ||||
| Contractor costs | It is common practice for an IDA funding agency to contract projects to a specialised private sector firm. This covers contractor costs other than those listed above. | — | Monthly during project life | $3k/month |
Project cost $ are expressed in US$ as that is typically the currency that an aid donor or a development bank will use. 1 US$ is assumed to be ~5 local $ or equivalent.
Table 6.2 Total project costs
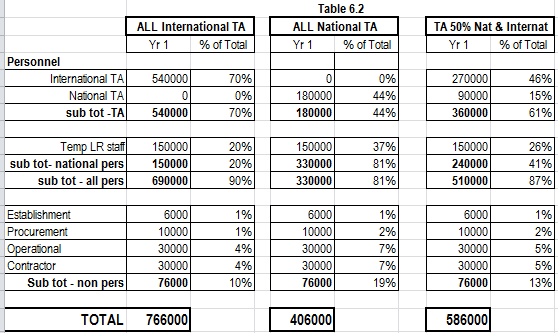
Comments
- Project costs are approximately halved ($406k cf $767k) if all TA is local rather than international
- The costs of international TA, if used exclusively, are 70% of project costs, due to international rates for fees, and the necessity to cover accommodation, per diems, and travel expenses.
- Personnel costs account for 80-90% of total project costs.
ANNEX B
SOME EXAMPLES OF VALUES OF REVENUE VARIABLES
Table 6.4 (Sec 6.4.1) showed the values of the main variables used to calculate revenue flow. They are considered reasonable guestimates. It can be quite difficult to find values in use. Burns et al (2006) have compiled some values for some countries. Some from their paper are shown in Table 6.5 below. Also included are values from other sources and the values from Table 6.4. Wide variations can be seen,
Table 6.5
| Indicator | Developing Economies | Developed Economies | Values Used in Chapter 6 | |||||
|---|---|---|---|---|---|---|---|---|
| Philippines | Thailand | Latvia, Indonesia, Trinidad | Some in South America | Typical Australian State | Hong Kong | UK | ||
| Values from Burns T et al. (2006) | ||||||||
| % of titleholders who use the LR | 85% | — | — | — | 100% | — | — | 70% |
| % of annual transactions as % of registered parcels | 11% | 21% | 5–8% | 14–18% | 20–24% | — | — | 7% |
| % of transactions that involve transfer of property | 4% | 13% | — | — | 7–10% | 9% | 6–12% | 6% |
| Stamp duty as % of sale price | 8.2% | 4.5% | 0.4–4% | — | 3–4% | — | — | 5% |
| Ratio annual revenue to expenditure | 2.4 | 5.8 | — | — | 2.7 | 1.30 | 1.1 | — |
| % transactions that take out new mortgages | — | — | — | — | 6% | 8% | 7% | — |
| Values taken from other sources | ||||||||
| Ratio annual revenue to expenditure | — | — | — | — | 2–6 (1) | — | — | — |
| Average value / sale price of property | — | — | — | — | — | — | — | US$20k |
| % of private land parcels formally titled | — | — | — | — | 100% | — | — | — |
| % of registered titles that have a mortgage | — | — | — | — | — | — | — | — |
| % homes that have a mortgage | — | — | — | — | 35% (2) | — | — | — |
Burns T et al (2006), Land Administration Reform: Indicators for Success, Future Challenges, Land Equity International
(1) some unpublished order of magnitude work carried out by K lyons in 2002
(2) the average home loan in Australia in 2018 was A$400k and the value of owner occupier loans written in July 2018 was A$21.2B. https://www.finder.com.au/australian-home-loan-statistics
ANNEX C
SOME NOTES on COST BENEFIT ANALYSIS (CBA)
In carrying out a CBA some financial indicators are normally calculated. They may include: -
- Net present value (NPV)
- Benefit to cost (B/C ratio)
- Payback period
- Peak deficit
The calculations of financial indicators rely on an estimation of cash flows. Typically expenditures are incurred early in the life of a project, and benefits tend to take place later in the project life. The net cash flow on an annual basis may be negative for a number of years and then increase and stabilise at positive values.
It is inappropriate to simply sum and compare these annual net cash flows, expressed in base year dollars, over the life of the project, commonly five or 10 years, since money at different points of time has different values. An amount of money now is worth more than the same amount several years into the future. In the meantime money could be used for some other profitable investment or a desirable consumption.
The technique of discounting is used to bring these annual net cash flow amounts to an equivalent amount in time. Discounting, means reducing benefit and cost values in future years in line with the rate of interest, thus providing present values (PV). A real rate of interest i.e. long-term market rate net of annual inflation rate is typically adopted.
If an inflation rate of 2% has been assumed, and a borrowing rate of 7% has been assumed, then the real interest rate is 5%, the difference between the two. Present value dollars are base year dollars reduced by the real interest rate, and future value dollars are base year dollars inflated by the borrowing interest rate. Future dollars are in dollars it will actually cost in some future year.
Net Present Value (NPV) - the most widely used measure of acceptability of a single project and of ranking of two or more projects. The NPV is the sum of the discounted net cash flows. A positive NPV implies that a project covers costs (i.e. it is profitable and worthwhile)
Benefit to Cost (B/C) ratio -this expresses the ratio of the net present value of costs to the net present value of benefits. A ratio greater than unity, implies that a project covers costs and is justifiable on economic grounds.
Payback Period – the number of years needed for cash flows to become positive and remain so for the rest of the project life.
Peak Deficit - this is the largest negative accumulative cash flow of a project after discounting. It indicates the maximum financing requirements.
ANNEX D
| Abbreviation | Meaning |
|---|---|
| B/C | Benefit to Cost Ratio |
| CBA | Cost Benefit Analysis |
| IC | In-Country |
| IDA | International Development Assistance |
| LA | Land Administration |
| LR | Land Registry |
| NPV | Net Present Value |
| O&M | Operation and Maintenance |
| PIP | Performance Improvement Proposal |
| SD | Strategy Dynamics |
| SCS | Schematic of the Core Structure |
| TA | Technical Assistance |
Footnotes
- 1 In practise these are many different types of applications, commonly with different lodgement fees ↩
- 2 http://www.doingbusiness.org/en/data/doing-business-score?topic=registering-property ↩